Quantcast
Channel: Cloudflare Blog
Viewing all 1117 articles
Browse latest View live

How "expensive" is crypto anyway?

$
0
0

I wouldn’t be surprised if the title of this post attracts some Bitcoin aficionados, but if you are such, I want to disappoint you. For me crypto means cryptography, not cybermoney, and the price we pay for it is measured in CPU cycles, not USD.

If you got to this second paragraph you probably heard that TLS today is very cheap to deploy. Considerable effort was put to optimize the cryptography stacks of OpenSSL and BoringSSL, as well as the hardware that runs them. However, aside for the occasional benchmark, that can tell us how many GB/s a given algorithm can encrypt, or how many signatures a certain elliptic curve can generate, I did not find much information about the cost of crypto in real world TLS deployments.

CC BY-SA 2.0 image by Michele M. F.

As Cloudflare is the largest provider of TLS on the planet, one would think we perform a lot of cryptography related tasks, and one would be absolutely correct. More than half of our external traffic is now TLS, as well as all of our internal traffic. Being in that position means that crypto performance is critical to our success, and as it happens, every now and then we like to profile our production servers, to identify and fix hot spots.

In this post I want to share the latest profiling results that relate to crypto.

The profiled server is located in our Frankfurt data center, and sports 2 Xeon Silver 4116 processors. Every geography has a slightly different use pattern of TLS. In Frankfurt 73% of the requests are TLS, and the negotiated cipher-suites break down like so:

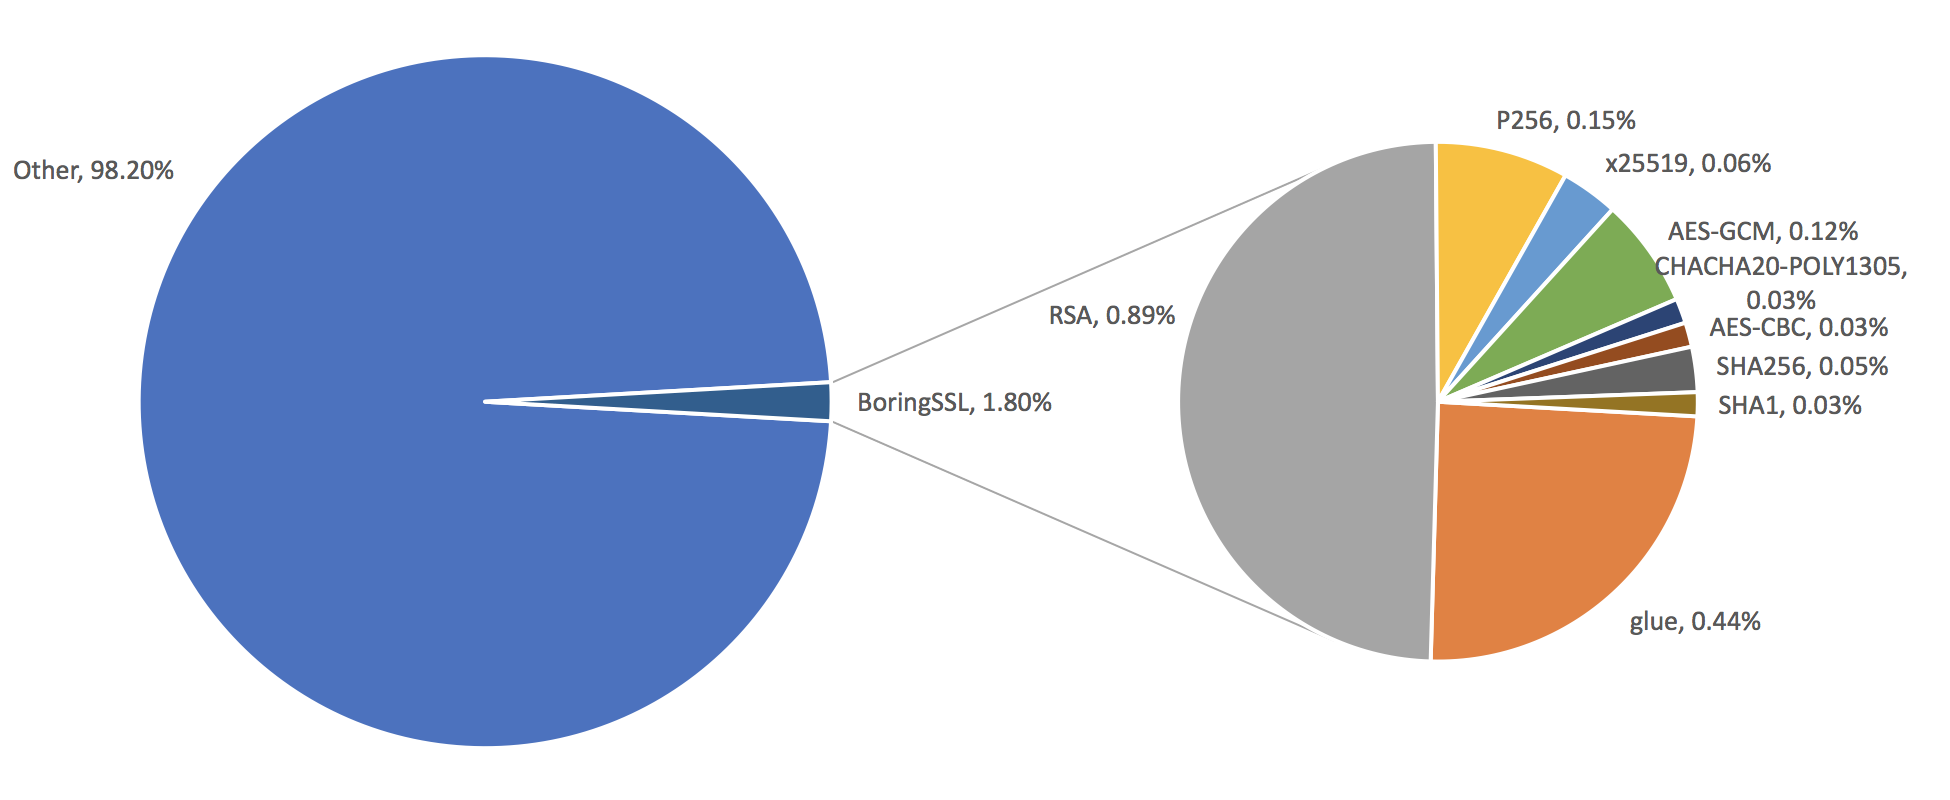
Processing all of those different ciphersuites, BoringSSL consumes just 1.8% of the CPU time. That’s right, mere 1.8%. And that is not even pure cryptography, there is a considerable overhead involved too.

Let’s take a deeper dive, shall we?

Ciphers

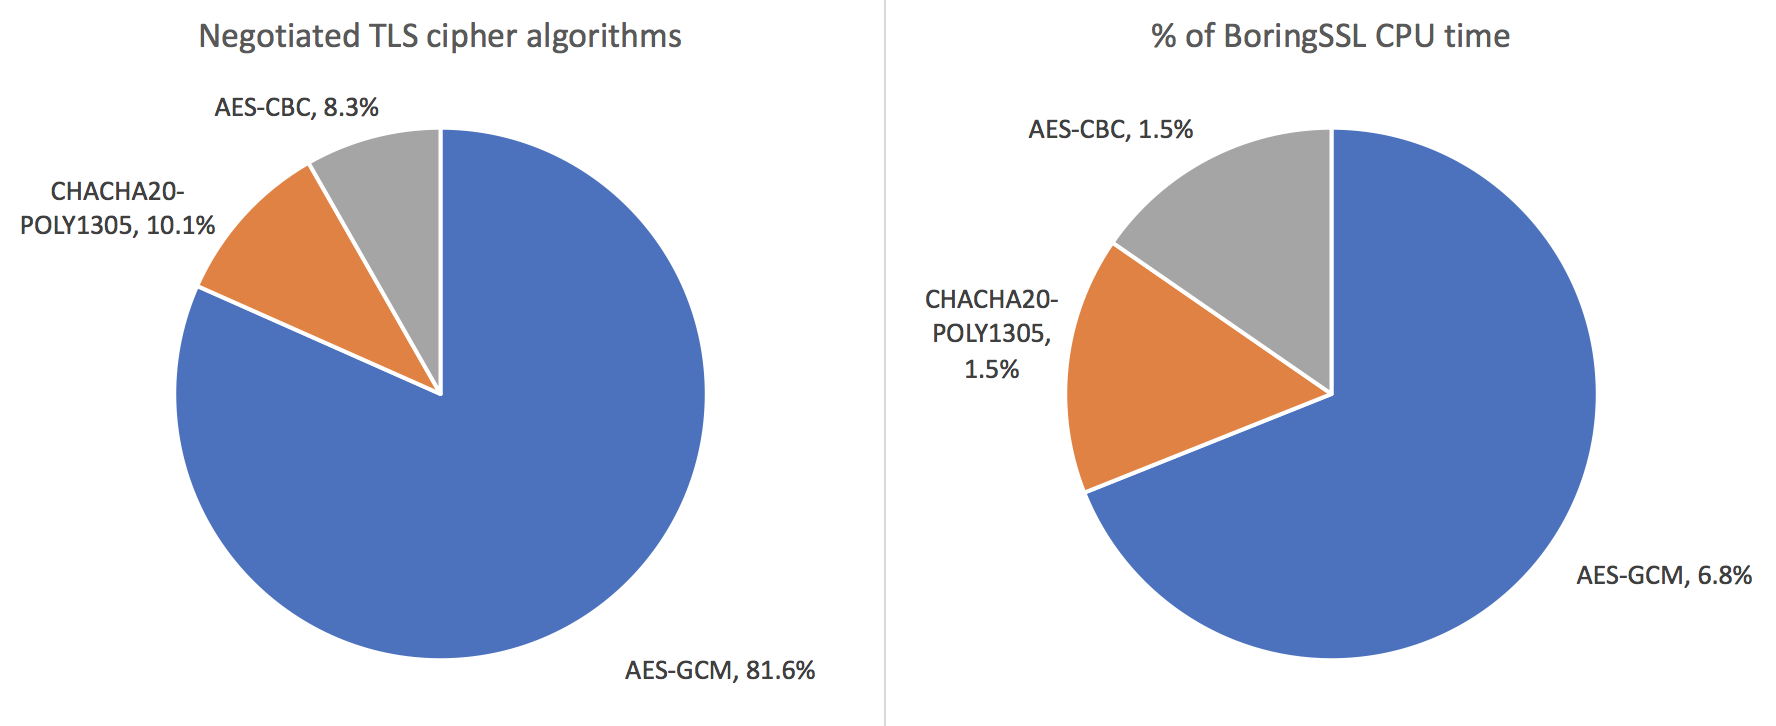
If we break down the negotiated cipher suites, by the AEAD used, we get the following breakdown:

BoringSSL speed tells us that AES-128-GCM, ChaCha20-Poly1305 and AES-128-CBC-SHA1 can achieve encryption speeds of 3,733.3 MB/s, 1,486.9 MB/s and 387.0 MB/s, but this speed varies greatly as a function of the record size. Indeed we see that GCM uses proportionately less CPU time.

Still the CPU time consumed by encryption and decryption depends on typical record size, as well as the amount of data processed, both metrics we don’t currently log. We do know that ChaCha20-Poly1305 is usually used by older phones, where the connections are short lived to save power, while AES-CBC is used for … well your guess is as good as mine who still uses AES-CBC and for what, but good thing its usage keeps declining.

Finally keep in mind that 6.8% of BoringSSL usage in the graph translates into 6.8% x 1.8% = 0.12% of total CPU time.

Public Key

Public key algorithms in TLS serve two functions.

The first function is as a key exchange algorithm, the prevalent algorithm here is ECDHE that uses the NIST P256 curve, the runner up is ECDHE using DJB’s x25519 curve. Finally there is a small fraction that still uses RSA for key exchange, the only key exchange algorithm currently used, that does not provide Forward Secrecy guarantees.

The second function is that of a signature used to sign the handshake parameters and thus authenticate the server to the client. As a signature RSA is very much alive, present in almost one quarter of the connections, the other three quarters using ECDSA.

BoringSSL speed reports that a single core on our server can perform 1,120 RSA2048 signatures/s, 120 RSA4096 signatures/s, 18,477 P256 ESDSA signatures/s, 9,394 P256 ECDHE operations/s and 9,278 x25519 ECDHE operations/s.

Looking at the CPU consumption, it is clear that RSA is very expensive. Roughly half the time BoringSSL performs an operation related to RSA. P256 consumes twice as much CPU time as x25519, but considering that it handles twice as much key-exchanges, while also being used as a signature, that is commendable.

If you want to make the internet a better place, please get an ECDSA signed certificate next time!

Hash functions

Only two hash function are currently used in TLS: SHA1 and SHA2 (including SHA384). SHA3 will probably debut with TLS1.3. Hash functions serve several purposes in TLS. First, they are used as part of the signature for both the certificate and the handshake, second they are used for key derivation, finally when using AES-CBC, SHA1 and SHA2 are used in HMAC to authenticate the records.

Here we see SHA1 consuming more resources than expected, but that is really because it is used as HMAC, whereas most cipher suites that negotiate SHA256 use AEADs. In terms of benchmarks BoringSSL speed reports 667.7 MB/s for SHA1, 309.0 MB/s for SHA256 and 436.0 MB/s for SHA512 (truncated to SHA384 in TLS, that is not visible in the graphs because its usage approaches 0%).

Conclusions

Using TLS is very cheap, even at the scale of Cloudflare. Modern crypto is very fast, with AES-GCM and P256 being great examples. RSA, once a staple of cryptography, that truly made SSL accessible to everyone, is now a dying dinosaur, replaced by faster and safer algorithms, still consumes a disproportionate amount of resources, but even that is easily manageable.

The future however is less clear. As we approach the era of Quantum computers it is clear that TLS must adapt sooner rather than later. We already support SIDH as a key exchange algorithm for some services, and there is a NIST competition in place, that will determine the most likely Post Quantum candidates for TLS adoption, but none of the candidates can outperform P256. I just hope that when I profile our edge two years from now, my conclusion won’t change to “Whoa, crypto is expensive!”.


Keeping your GDPR Resolutions

$
0
0
Keeping your GDPR Resolutions

For many of us, a New Year brings a renewed commitment to eat better, exercise regularly, and read more (especially the Cloudflare blog). But as we enter 2018, there is a unique and significant new commitment approaching -- protecting personal data and complying with the European Union’s (EU) General Data Protection Regulation (GDPR).

As many of you know by now, the GDPR is a sweeping new EU law that comes into effect on May 25, 2018. The GDPR harmonizes data privacy laws across the EU and mandates how companies collect, store, delete, modify and otherwise process personal data of EU citizens.

Since our founding, Cloudflare has believed that the protection of our customers’ and their end users’ data is essential to our mission to help build a better internet.

Keeping your GDPR ResolutionsImage by GregMontani via Wikimedia Commons

Need a Data Processing Agreement?

As we explained in a previous blog post last August, Cloudflare has been working hard to achieve GDPR compliance in advance of the effective date, and is committed to help our customers and their partners prepare for GDPR compliance on their side. We understand that compliance with a new set of privacy laws can be challenging, and we are here to help with your GDPR compliance requirements.

First, we are committed to making sure Cloudflare’s services are GDPR compliant and will continue to monitor new guidance on best practices even after the May 25th, 2018 effective date. We have taken these new requirements to heart and made changes to our products, contracts and policies.

And second, we have made it easy for you to comply with your own obligations. If you are a Cloudflare customer and have determined that you qualify as a data controller under the GDPR, you may need a data processing addendum (DPA) in place with Cloudflare as a qualifying vendor. We’ve made that part of the process easy for you.

This is all you need to do:

  • Go here to find our GDPR-compliant DPA, which has been pre-signed on behalf of Cloudflare.
  • To complete the DPA, you should fill in the “Customer” information and sign on pages 6, 13, 15, and 19.
  • Send an electronic copy of the fully executed DPA to Cloudflare at eu.dpa@cloudflare.com.

That’s it. Now you’re one step closer to GDPR compliance.

We can’t help you with the diet, exercise, and reading stuff. But if you need more information about GDPR and more resources, you can go to Cloudflare’s GDPR page.

An Explanation of the Meltdown/Spectre Bugs for a Non-Technical Audience

$
0
0
An Explanation of the Meltdown/Spectre Bugs for a Non-Technical Audience

Last week the news of two significant computer bugs was announced. They've been dubbed Meltdown and Spectre. These bugs take advantage of very technical systems that modern CPUs have implemented to make computers extremely fast. Even highly technical people can find it difficult to wrap their heads around how these bugs work. But, using some analogies, it's possible to understand exactly what's going on with these bugs. If you've found yourself puzzled by exactly what's going on with these bugs, read on — this blog is for you.

An Explanation of the Meltdown/Spectre Bugs for a Non-Technical Audience

When you come to a fork in the road, take it.” — Yogi Berra

Late one afternoon walking through a forest near your home and navigating with the GPS you come to a fork in the path which you’ve taken many times before. Unfortunately, for some mysterious reason your GPS is not working and being a methodical person you like to follow it very carefully.

Cooling your heels waiting for GPS to start working again is annoying because you are losing time when you could be getting home. Instead of waiting, you decide to make an intelligent guess about which path is most likely based on past experience and set off down right hand path.

After walking for a short distance the GPS comes to life and tells you which is the correct path. If you predicted correctly then you’ve saved a significant amount of time. If not, then you hop over to the other path and carry on that way.

An Explanation of the Meltdown/Spectre Bugs for a Non-Technical Audience

Something just like this happens inside the CPU in pretty much every computer. Fundamental to the very essence and operation of a computer is the ability to branch, to choose between two different code paths. As you read this, your web browser is making branch decisions continuously (for example, some part of it is waiting for you to click a link to go to some other page).

One way that CPUs have reached incredible speeds is the ability to predict which of two branches is most likely and start executing it before it knows whether that’s the correct path to take.

For example, the code that checks for you clicking this link might be a little slow because it’s waiting for mouse movements and button clicks. Rather than wait the CPU will start automatically executing the branch it thinks is most likely (probably that you don’t click the link). Once the check actually indicates “clicked” or “not clicked” the CPU will either continue down the branch it took, or abandon the code it has executed and restart at the ‘fork in the path’.

This is known as “branch prediction” and saves a great deal of idling processor time. It relies on the ability of the CPU to run code “speculatively” and throw away results if that code should not have been run in the first place.

An Explanation of the Meltdown/Spectre Bugs for a Non-Technical Audience

Every time you’ve taken the right hand path in the past it’s been correct, but today it isn’t. Today it’s winter and the foliage is sparser and you’ll see something you shouldn’t down that path: a secret government base hiding alien technology.

But wanting to get home fast you take the path anyway not realizing that the GPS is going to indicate that left hand path today and keep you out of danger. Before the GPS comes back to life you catch a glimpse of an alien through the trees.

Moments later two Men In Black appear, erase your memory and dump you back at the fork in the path. Shortly after, the GPS beeps and you set off down the left hand path none the wiser.

An Explanation of the Meltdown/Spectre Bugs for a Non-Technical Audience

Something similar to this happens in the Spectre/Meltdown attack. The CPU starts executing a branch of code that it has previously learnt is typically the right code to run. But it’s been tricked by a clever attacker and this time it’s the wrong branch. Worse, the code will access memory that it shouldn’t (perhaps from another program) giving it access to otherwise secret information (such as passwords).

When the CPU realizes it’s gone the wrong way it forgets all the erroneous work it’s done (and the fact that it accessed memory it shouldn’t have) and executes the correct branch instead. Even though illegal memory was accessed what it contained has been forgotten by the CPU.

The core of Meltdown and Spectre is the ability to exfiltrate information, from this speculatively executed code, concerning the illegally accessed memory through what’s known as a “side channel”.

An Explanation of the Meltdown/Spectre Bugs for a Non-Technical Audience

You’d actually heard rumours of Men In Black and want to find some way of letting yourself know whether you saw aliens or not. Since there’s a short space between you seeing aliens and your memory being erased you come up with a plan.

If you see aliens then you gulp down an energy drink that you have in your backpack. Once deposited back at the fork by the Men In Black you can discover whether you drank the energy drink (and therefore whether you saw aliens) by walking 500 metres and timing yourself. You’ll go faster with the extra carbs in a can of Reactor Core.

An Explanation of the Meltdown/Spectre Bugs for a Non-Technical Audience

Computers have also reached high speeds by keeping a copy of frequently or recently accessed information inside the CPU itself. The closer data is to the CPU the faster it can be used.

This store of recently/frequently used data inside the CPU is called a “cache”. Both branch prediction and the cache mean that CPUs are blazingly fast. Sadly, they can also be combined to create the security problems that have recently been reported with Intel and other CPUs.

In the Meltdown/Spectre attacks, the attacker determines what secret information (the real world equivalent of the aliens) was accessed using timing information (but not an energy drink!). In the split second after accessing illegal memory, and before the code being run is forgotten by the CPU, the attacker’s code loads a single byte into the CPU cache. A single byte which it has perfectly legal access to; something from its own program memory!

The attacker can then determine what happened in the branch just by trying to read the same byte: if it takes a long time to read then it wasn’t in cache, if it doesn’t take long then it was. The difference in timing is all the attacker needs to know what occurred in the branch the CPU should never have executed.

To turn this into an exploit that actually reads illegal memory is easy. Just repeat this process over and over again once per single bit of illegal memory that you are reading. Each single bit’s 1 or 0 can be translated into the presence or absence of an item in the CPU cache which is ‘read’ using the timing trick above.

Although that might seem like a laborious process, it is, in fact, something that can be done very quickly enabling the dumping of the entire memory of a computer. In the real world it would be impractical to hike down the path and get zapped by the Men In Black in order to leak details of the aliens (their color, size, language, etc.), but in a computer it’s feasible to redo the branch over and over again because of the inherent speed (100s of millions of branches per second!).

And if an attacker can dump the memory of a computer it has access to the crown jewels: what’s in memory at any moment is likely to be very, very sensitive: passwords, cryptographic secrets, the email you are writing, a private chat and more.

Conclusion

I hope that this helps you understand the essence of Meltdown and Spectre. There are many variations of both attacks that all rely on the same ideas: get the CPU to speculatively run some code (through branch prediction or another technique) that illegally accesses memory and extract information using a timing side channel through the CPU cache.

If you care to read all the gory detail there’s a paper on Meltdown and a separate one on Spectre.

Acknowledgements: I’m grateful to all the people who read this and gave me feedback (including gently telling me the ways in which I didn’t understand branch prediction and speculative execution). Thank you especially to David Wragg, Kenton Varda, Chris Branch, Vlad Krasnov, Matthew Prince, Michelle Zatlyn and Ben Cartwright-Cox. And huge thanks for Kari Linder for the illustrations.

Welcome Salt Lake City and Get Ready for a Massive Expansion

$
0
0
Welcome Salt Lake City and Get Ready for a Massive Expansion

Welcome Salt Lake City and Get Ready for a Massive Expansion

We just turned up Salt Lake City, Utah — Cloudflare's 120th data center. Salt Lake holds a special place in Cloudflare's history. I grew up in the region and still have family there. Back in 2004, Lee Holloway and I lived just up into the mountains in Park City when we built Project Honey Pot, the open source project that inspired the original idea for Cloudflare.

Welcome Salt Lake City and Get Ready for a Massive Expansion

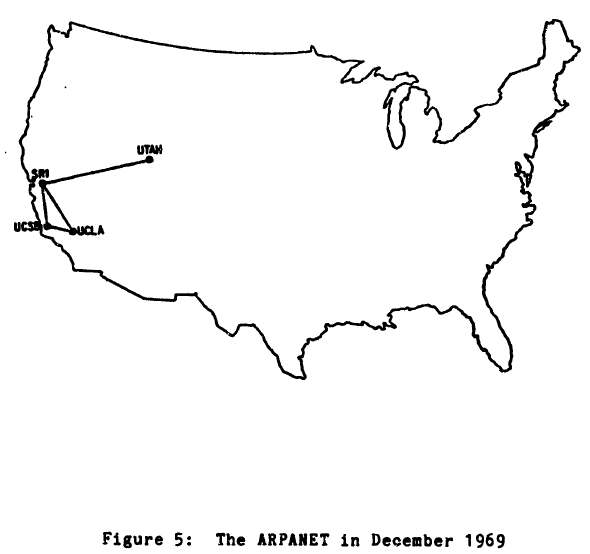
Salt Lake also holds a special place in the history of the Internet. The University of Utah, based there, was one of the original four Arpanet locations (along with UCLA, UC Santa Barbara, and the Stanford Research Institute). The school also educated the founders of great technology companies like Silicon Graphics, Adobe, Atari, Netscape, and Pixar. Many were graduates of the computer graphics department lead by Professors Ivan Sutherland and David Evans.

Welcome Salt Lake City and Get Ready for a Massive Expansion

In 1980, when I was seven years old, my grandmother, who lived a few blocks from the University, gave me an Apple II+ for Christmas. I took to it like a duck to water. My mom enrolled in a continuing education computer course at the University of Utah teaching BASIC programming. I went with her to the classes. Unbeknownst to the professor, I was the one completing the assignments.

Cloudflare, the Internet, and I owe a lot to Salt Lake City so it was high time we turned up a location there.

Our Big Network Expansion In 2018

Salt Lake is just the beginning for 2018. We have big plans. By the end of the year, we're forecasting that we'll have facilities in 200 cities and 100 countries worldwide. Twelve months from now we expect that 95% of the world's population will live in a country with a Cloudflare data center.

Welcome Salt Lake City and Get Ready for a Massive Expansion

We've front loaded this expansion in the first quarter of this year. We currently have equipment on the ground in 30 new cities. Our SRE team is working to get them all turned up over the course of the next three months. To give you some sense of the pace, that's almost twice as many cities as we turned up in all of 2017. Stay tuned for a lot more blog posts about new cities over the months ahead.

Happy New Year!

SYN packet handling in the wild

$
0
0
SYN packet handling in the wild

Here at Cloudflare, we have a lot of experience of operating servers on the wild Internet. But we are always improving our mastery of this black art. On this very blog we have touched on multiple dark corners of the Internet protocols: like understanding FIN-WAIT-2 or receive buffer tuning.

SYN packet handling in the wild
CC BY 2.0 image by Isaí Moreno

One subject hasn't had enough attention though - SYN floods. We use Linux and it turns out that SYN packet handling in Linux is truly complex. In this post we'll shine some light on this subject.

The tale of two queues

SYN packet handling in the wild

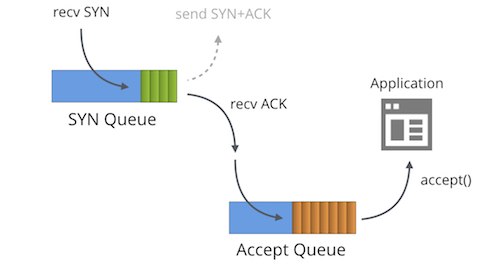
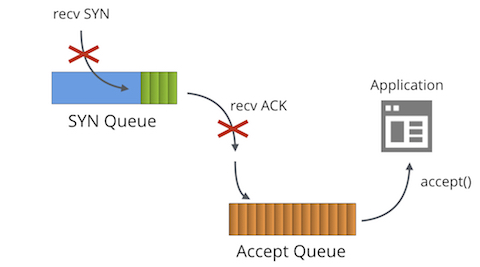
First we must understand that each bound socket, in the "LISTENING" TCP state has two separate queues:

  • The SYN Queue
  • The Accept Queue

In the literature these queues are often given other names such as "reqsk_queue", "ACK backlog", "listen backlog" or even "TCP backlog", but I'll stick to the names above to avoid confusion.

SYN Queue

The SYN Queue stores inbound SYN packets[1] (specifically: struct inet_request_sock). It's responsible for sending out SYN+ACK packets and retrying them on timeout. On Linux the number of retries is configured with:

$ sysctl net.ipv4.tcp_synack_retries
net.ipv4.tcp_synack_retries = 5

The docs describe this toggle:

tcp_synack_retries - INTEGER

	Number of times SYNACKs for a passive TCP connection attempt
	will be retransmitted. Should not be higher than 255. Default
	value is 5, which corresponds to 31 seconds till the last
	retransmission with the current initial RTO of 1second. With
	this the final timeout for a passive TCP connection will
	happen after 63 seconds.

After transmitting the SYN+ACK, the SYN Queue waits for an ACK packet from the client - the last packet in the three-way-handshake. All received ACK packets must first be matched against the fully established connection table, and only then against data in the relevant SYN Queue. On SYN Queue match, the kernel removes the item from the SYN Queue, happily creates a fully fledged connection (specifically: struct inet_sock), and adds it to the Accept Queue.

Accept Queue

The Accept Queue contains fully established connections: ready to be picked up by the application. When a process calls accept(), the sockets are de-queued and passed to the application.

This is a rather simplified view of SYN packet handling on Linux. With socket toggles like TCP_DEFER_ACCEPT[2] and TCP_FASTOPEN things work slightly differently.

Queue size limits

The maximum allowed length of both the Accept and SYN Queues is taken from the backlog parameter passed to the listen(2) syscall by the application. For example, this sets the Accept and SYN Queue sizes to 1,024:

listen(sfd, 1024)

Note: In kernels before 4.3 the SYN Queue length was counted differently.

This SYN Queue cap used to be configured by the net.ipv4.tcp_max_syn_backlog toggle, but this isn't the case anymore. Nowadays net.core.somaxconn caps both queue sizes. On our servers we set it to 16k:

$ sysctl net.core.somaxconn
net.core.somaxconn = 16384

Perfect backlog value

Knowing all that, we might ask the question - what is the ideal backlog parameter value?

The answer is: it depends. For the majority of trivial TCP Servers it doesn't really matter. For example Golang famously doesn't support customizing backlog and hardcodes it to 128. There are valid reasons to increase this value though:

  • When the rate of incoming connections is really large, even with a performant application, the inbound SYN Queue may need a larger number of slots.
  • The backlog value controls the SYN Queue size. This effectively can be read as "ACK packets in flight". The larger the average round trip time to the client, the more slots are going to be used. In the case of many clients far away from the server, hundreds of milliseconds away, it makes sense to increase the backlog value.
  • The TCP_DEFER_ACCEPT option causes sockets to remain in the SYN-RECV state longer and contribute to the queue limits.

Overshooting the backlog is bad as well:

  • Each slot in SYN Queue uses some memory. During a SYN Flood it makes no sense to waste resources on storing attack packets. Each struct inet_request_sock entry in SYN Queue takes 256 bytes of memory on kernel 4.14.

To peek into the SYN Queue on Linux we can use the ss command and look for SYN-RECV sockets. For example, on one of Cloudflare's servers we can see 119 slots used in tcp/80 SYN Queue and 78 on tcp/443.

$ ss -n state syn-recv sport = :80 | wc -l
119
$ ss -n state syn-recv sport = :443 | wc -l
78

Similar data can be shown with our overenginered SystemTap script: resq.stp.

Slow application

SYN packet handling in the wild

What happens if the application can't keep up with calling accept() fast enough?

This is when the magic happens! When the Accept Queue gets full (is of a size of backlog+1) then:

  • Inbound SYN packets to the SYN Queue are dropped.
  • Inbound ACK packets to the SYN Queue are dropped.
  • The TcpExtListenOverflows / LINUX_MIB_LISTENOVERFLOWS counter is incremented.
  • The TcpExtListenDrops / LINUX_MIB_LISTENDROPS counter is incremented.

There is a strong rationale for dropping inbound packets: it's a push-back mechanism. The other party will sooner or later resend the SYN or ACK packets by which point, the hope is, the slow application will have recovered.

This is a desirable behavior for almost all servers. For completeness: it can be adjusted with the global net.ipv4.tcp_abort_on_overflow toggle, but better not touch it.

If your server needs to handle a large number of inbound connections and is struggling with accept() throughput, consider reading our Nginx tuning / Epoll work distribution post and a follow up showing useful SystemTap scripts.

You can trace the Accept Queue overflow stats by looking at nstat counters:

$ nstat -az TcpExtListenDrops
TcpExtListenDrops     49199     0.0

This is a global counter. It's not ideal - sometimes we saw it increasing, while all applications looked healthy! The first step should always be to print the Accept Queue sizes with ss:

$ ss -plnt sport = :6443|cat
State   Recv-Q Send-Q  Local Address:Port  Peer Address:Port
LISTEN  0      1024                *:6443             *:*

The column Recv-Q shows the number of sockets in the Accept Queue, and Send-Q shows the backlog parameter. In this case we see there are no outstanding sockets to be accept()ed, but we still saw the ListenDrops counter increasing.

It turns out our application was stuck for fraction of a second. This was sufficient to let the Accept Queue overflow for a very brief period of time. Moments later it would recover. Cases like this are hard to debug with ss, so we wrote an acceptq.stp SystemTap script to help us. It hooks into kernel and prints the SYN packets which are being dropped:

$ sudo stap -v acceptq.stp
time (us)        acceptq qmax  local addr    remote_addr
1495634198449075  1025   1024  0.0.0.0:6443  10.0.1.92:28585
1495634198449253  1025   1024  0.0.0.0:6443  10.0.1.92:50500
1495634198450062  1025   1024  0.0.0.0:6443  10.0.1.92:65434
...

Here you can see precisely which SYN packets were affected by the ListenDrops. With this script it's trivial to understand which application is dropping connections.

SYN packet handling in the wild
CC BY 2.0 image by internets_dairy

SYN Flood

SYN packet handling in the wild

If it's possible to overflow the Accept Queue, it must be possible to overflow the SYN Queue as well. What happens in that case?

This is what SYN Flood attacks are all about. In the past flooding the SYN Queue with bogus spoofed SYN packets was a real problem. Before 1996 it was possible to successfully deny the service of almost any TCP server with very little bandwidth, just by filling the SYN Queues.

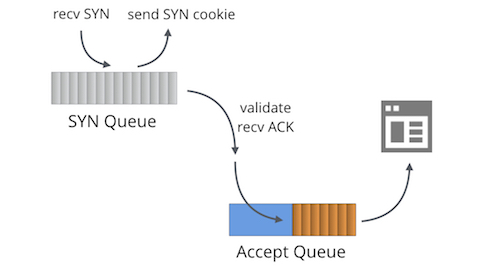
The solution is SYN Cookies. SYN Cookies are a construct that allows the SYN+ACK to be generated statelessly, without actually saving the inbound SYN and wasting system memory. SYN Cookies don't break legitimate traffic. When the other party is real, it will respond with a valid ACK packet including the reflected sequence number, which can be cryptographically verified.

By default SYN Cookies are enabled when needed - for sockets with a filled up SYN Queue. Linux updates a couple of counters on SYN Cookies. When a SYN cookie is being sent out:

  • TcpExtTCPReqQFullDoCookies / LINUX_MIB_TCPREQQFULLDOCOOKIES is incremented.
  • TcpExtSyncookiesSent / LINUX_MIB_SYNCOOKIESSENT is incremented.
  • Linux used to increment TcpExtListenDrops but doesn't from kernel 4.7.

When an inbound ACK is heading into the SYN Queue with SYN cookies engaged:

  • TcpExtSyncookiesRecv / LINUX_MIB_SYNCOOKIESRECV is incremented when crypto validation succeeds.
  • TcpExtSyncookiesFailed / LINUX_MIB_SYNCOOKIESFAILED is incremented when crypto fails.

A sysctl net.ipv4.tcp_syncookies can disable SYN Cookies or force-enable them. Default is good, don't change it.

SYN Cookies and TCP Timestamps

The SYN Cookies magic works, but isn't without disadvantages. The main problem is that there is very little data that can be saved in a SYN Cookie. Specifically, only 32 bits of the sequence number are returned in the ACK. These bits are used as follows:

+----------+--------+-------------------+
|  6 bits  | 2 bits |     24 bits       |
| t mod 32 |  MSS   | hash(ip, port, t) |
+----------+--------+-------------------+

With the MSS setting truncated to only 4 distinct values, Linux doesn't know any optional TCP parameters of the other party. Information about Timestamps, ECN, Selective ACK, or Window Scaling is lost, and can lead to degraded TCP session performance.

Fortunately Linux has a work around. If TCP Timestamps are enabled, the kernel can reuse another slot of 32 bits in the Timestamp field. It contains:

+-----------+-------+-------+--------+
|  26 bits  | 1 bit | 1 bit | 4 bits |
| Timestamp |  ECN  | SACK  | WScale |
+-----------+-------+-------+--------+

TCP Timestamps should be enabled by default, to verify see the sysctl:

$ sysctl net.ipv4.tcp_timestamps
net.ipv4.tcp_timestamps = 1

Historically there was plenty of discussion about the usefulness of TCP Timestamps.

Currently at Cloudflare, we have TCP Timestamps disabled.

Finally, with SYN Cookies engaged some cool features won't work - things like TCP_SAVED_SYN, TCP_DEFER_ACCEPT or TCP_FAST_OPEN.

SYN Floods at Cloudflare scale

SYN packet handling in the wild

SYN Cookies are a great invention and solve the problem of smaller SYN Floods. At Cloudflare though, we try to avoid them if possible. While sending out a couple of thousand of cryptographically verifiable SYN+ACK packets per second is okay, we see attacks of more than 200 Million packets per second. At this scale, our SYN+ACK responses would just litter the internet, bringing absolutely no benefit.

Instead, we attempt to drop the malicious SYN packets on the firewall layer. We use the p0f SYN fingerprints compiled to BPF. Read more in this blog post Introducing the p0f BPF compiler. To detect and deploy the mitigations we developed an automation system we call "Gatebot". We described that here Meet Gatebot - the bot that allows us to sleep

Evolving landscape

For more - slightly outdated - data on the subject read on an excellent explanation by Andreas Veithen from 2015 and a comprehensive paper by Gerald W. Gordon from 2013.

The Linux SYN packet handling landscape is constantly evolving. Until recently SYN Cookies were slow, due to an old fashioned lock in the kernel. This was fixed in 4.4 and now you can rely on the kernel to be able to send millions of SYN Cookies per second, practically solving the SYN Flood problem for most users. With proper tuning it's possible to mitigate even the most annoying SYN Floods without affecting the performance of legitimate connections.

Application performance is also getting significant attention. Recent ideas like SO_ATTACH_REUSEPORT_EBPF introduce a whole new layer of programmability into the network stack.

It's great to see innovations and fresh thinking funneled into the networking stack, in the otherwise stagnant world of operating systems.

Thanks to Binh Le for helping with this post.


Dealing with the internals of Linux and NGINX sound interesting? Join our world famous team in London, Austin, San Francisco and our elite office in Warsaw, Poland.


  1. I'm simplifying, technically speaking the SYN Queue stores not yet ESTABLISHED connections, not SYN packets themselves. With TCP_SAVE_SYN it gets close enough though. ↩︎

  2. If TCP_DEFER_ACCEPT is new to you, definitely check FreeBSD's version of it - accept filters. ↩︎

Introducing Cloudflare Access: Like BeyondCorp, But You Don’t Have To Be A Google Employee To Use It

$
0
0
Introducing Cloudflare Access: Like BeyondCorp, But You Don’t Have To Be A Google Employee To Use It

Tell me if this sounds familiar: any connection from inside the corporate network is trusted and any connection from the outside is not. This is the security strategy used by most enterprises today. The problem is that once the firewall, or gateway, or VPN server creating this perimeter is breached, the attacker gets immediate, easy and trusted access to everything.

Introducing Cloudflare Access: Like BeyondCorp, But You Don’t Have To Be A Google Employee To Use It CC BY-SA 2.0 image by William Warby

There’s a second problem with the traditional security perimeter model. It either requires employees to be on the corporate network (i.e. physically in the office) or using a VPN, which slows down work because every page load makes extra round trips to the VPN server. After all this hassle, users on the VPN are still highly susceptible to phishing, man-in-the-middle and SQL injection attacks.

A few years ago, Google pioneered a solution for their own employees called BeyondCorp. Instead of keeping their internal applications on the intranet, they made them accessible on the internet. There became no concept of in or outside the network. The network wasn’t some fortified citadel, everything was on the internet, and no connections were trusted. Everyone had to prove they are who they say they are.

Cloudflare’s mission has always been to democratize the tools of the internet giants. Today we are launching Cloudflare Access: a perimeter-less access control solution for cloud and on-premise applications. It’s like BeyondCorp, but you don’t have to be a Google employee to use it.

Introducing Cloudflare Access: Like BeyondCorp, But You Don’t Have To Be A Google Employee To Use It

How does Cloudflare Access work ?

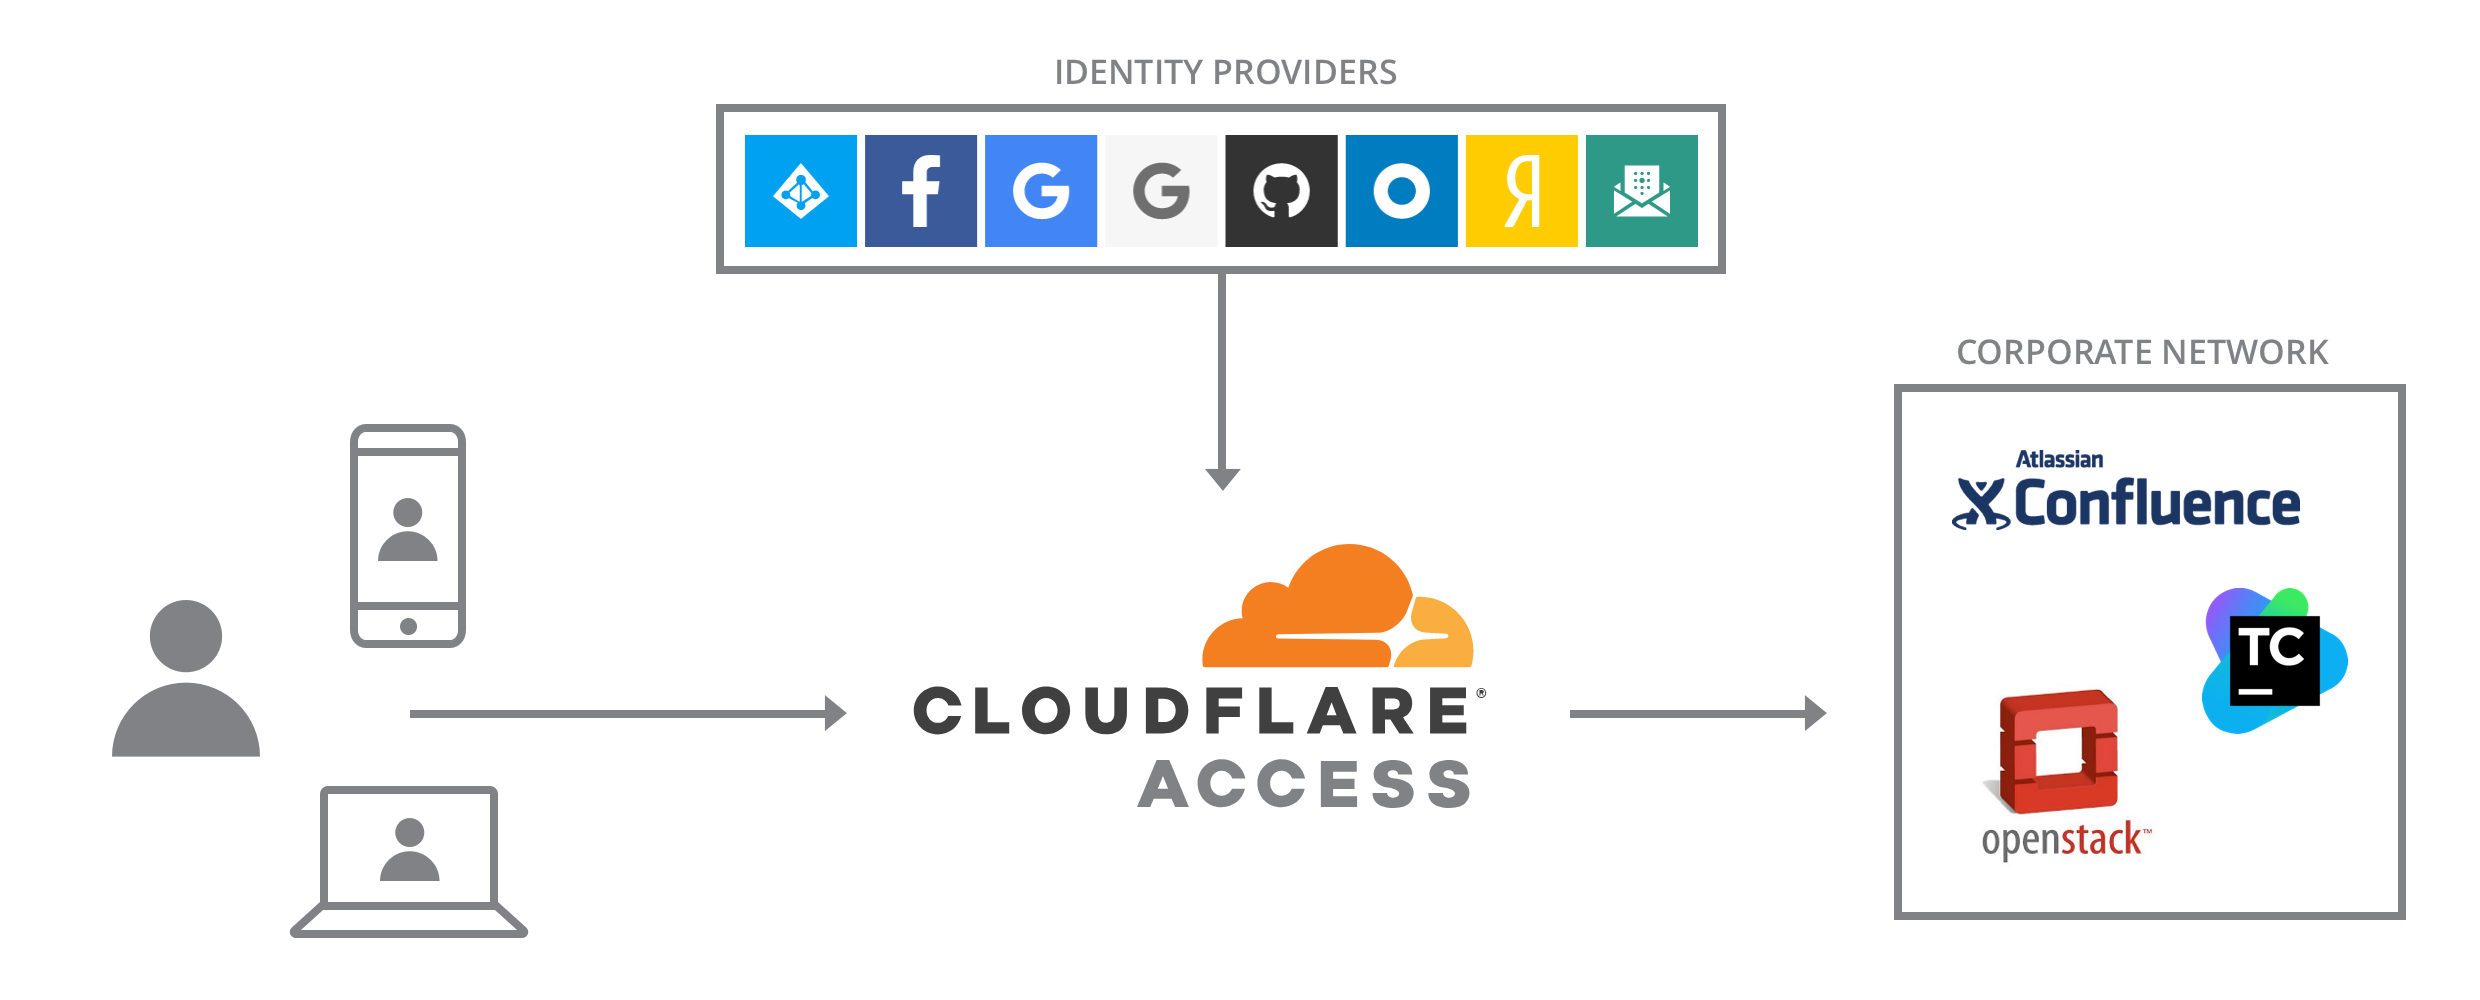
Access acts as an unified reverse proxy to enforce access control by making sure every request is:

Authenticated: Access integrates out of the box with most of the major identity providers like Google, Azure Active Directory and Okta meaning you can quickly connect your existing identity provider to Cloudflare and use the groups and users already created to gate access to your web applications. You can additionally use TLS with Client Authentication and limit connections only to devices with a unique client certificate. Cloudflare will ensure the connecting device has a valid client certificate signed by the corporate CA, then Cloudflare will authenticate user credentials to grant access to an internal application.

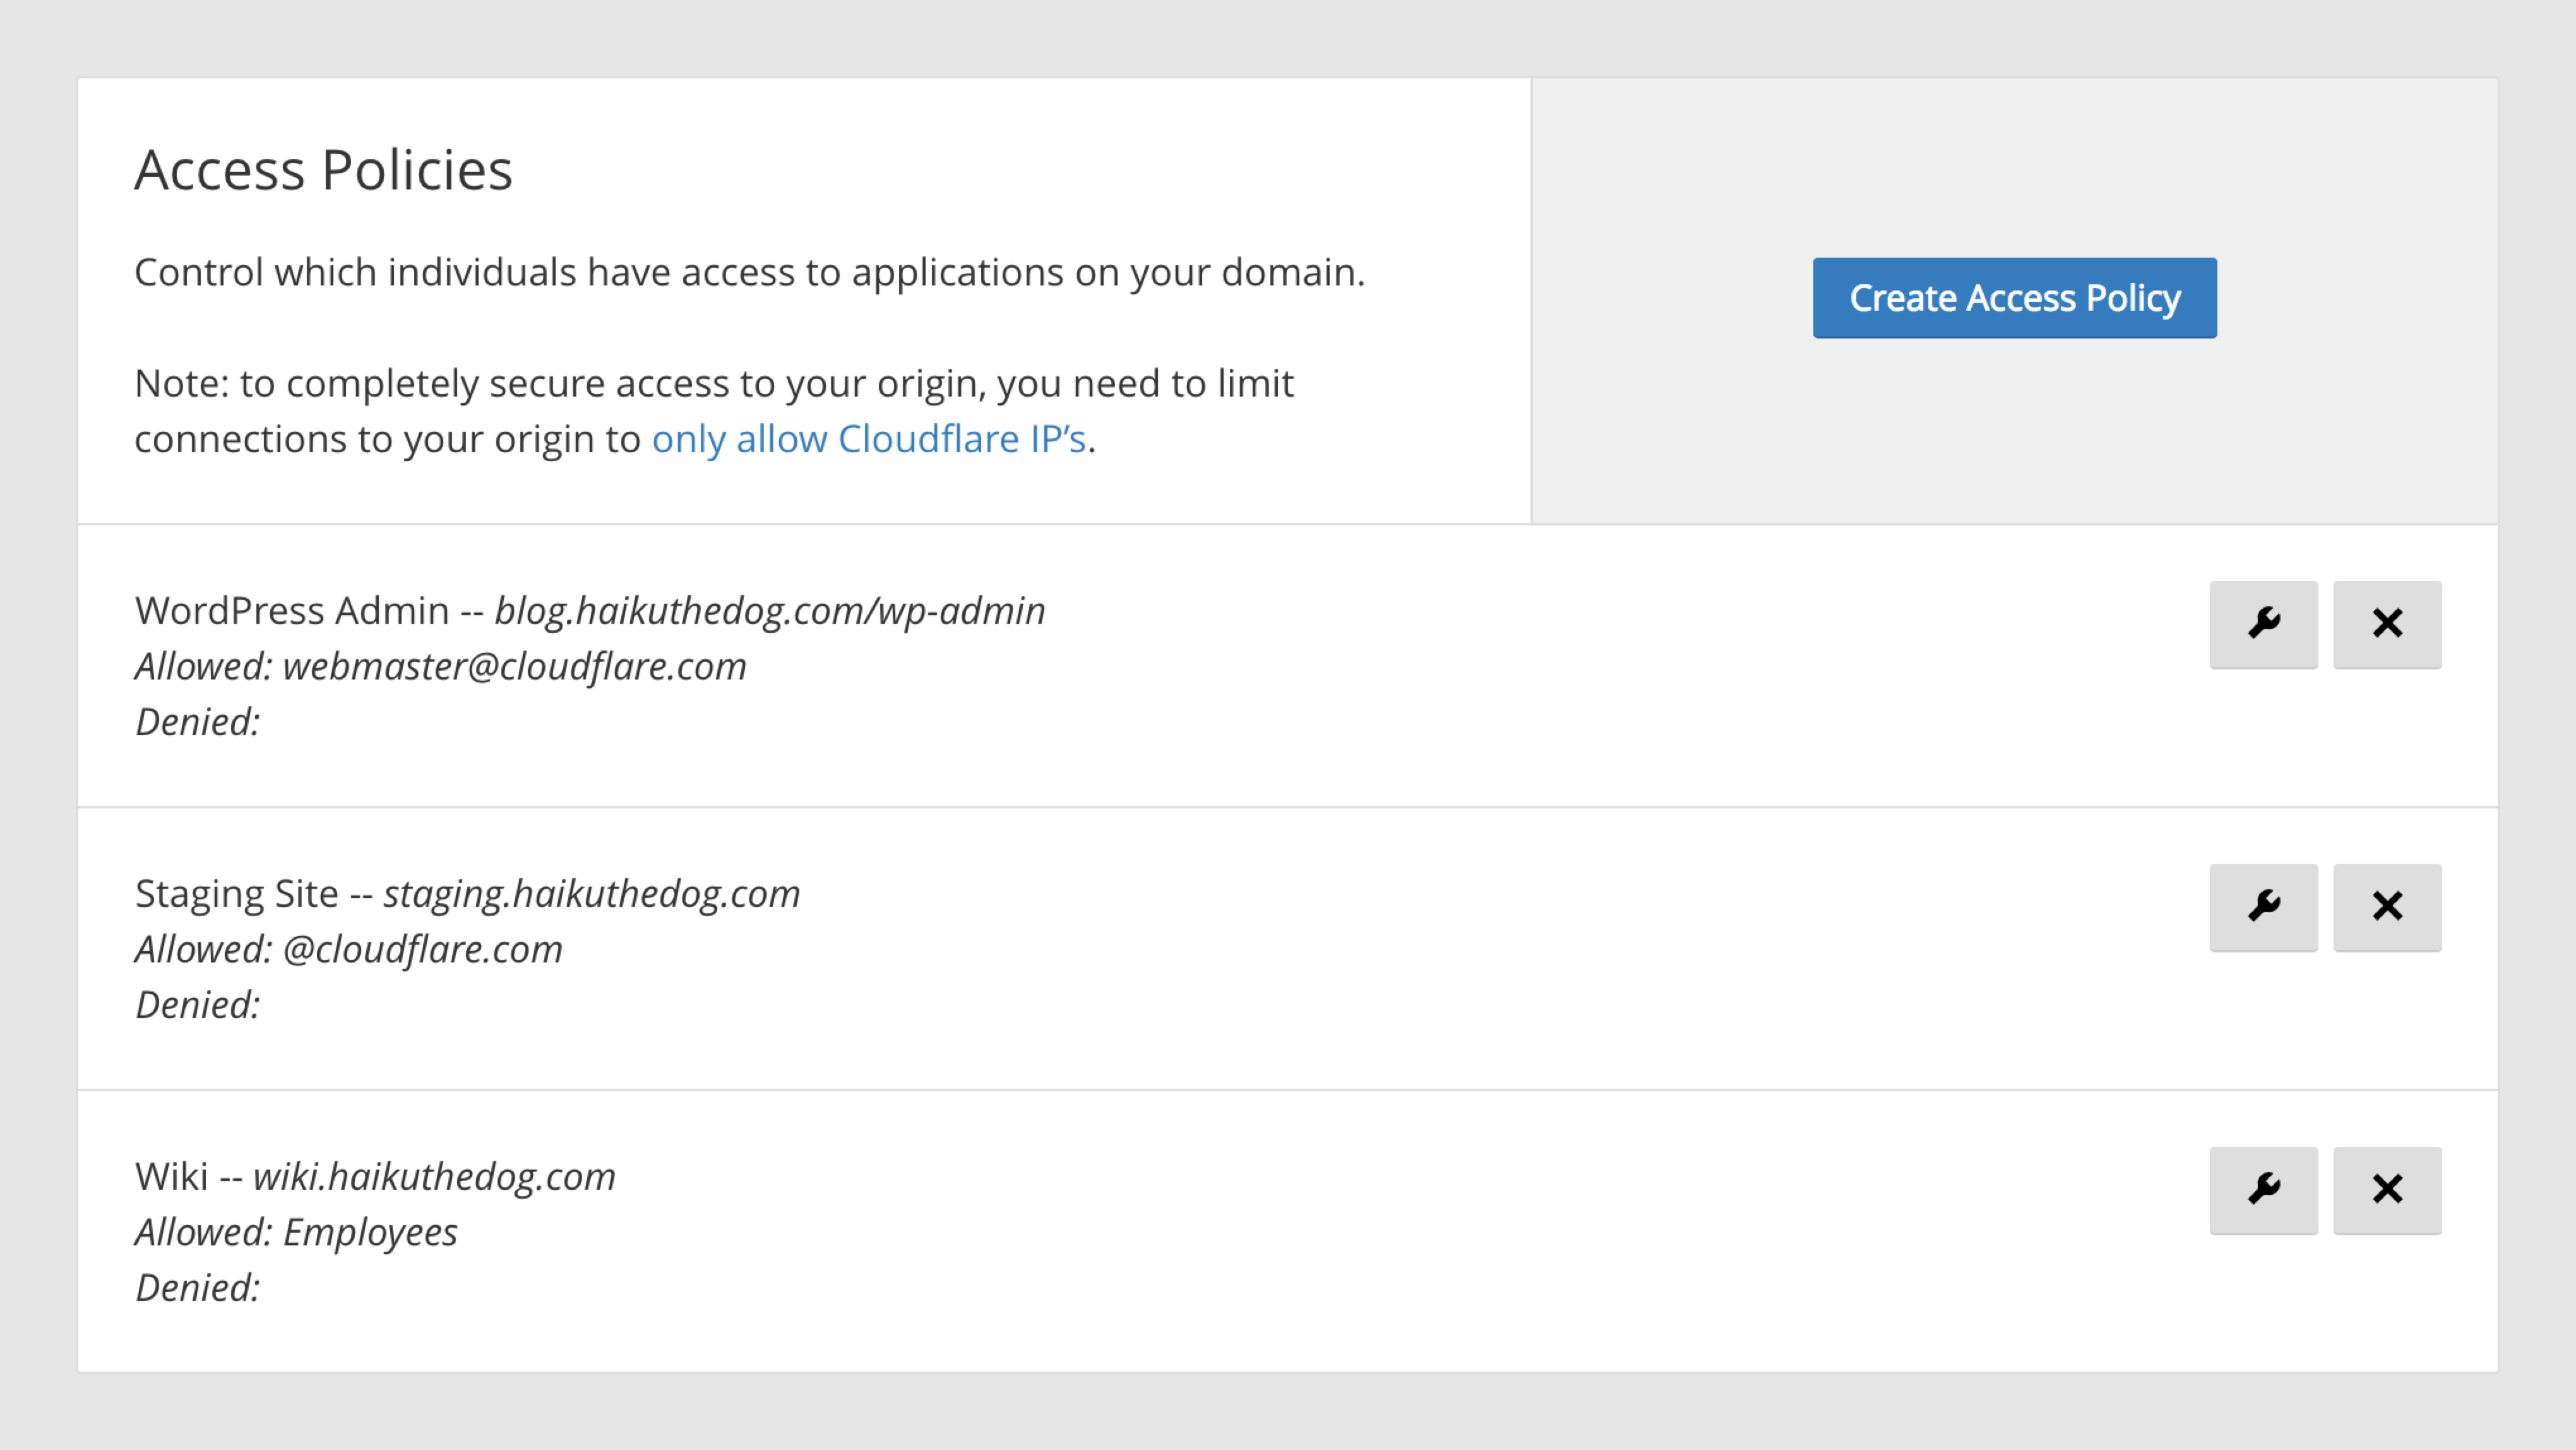
Authorized: The solution lets you easily protect application resources by configuring access policies for groups and individual users that you already created with your identity providers. For example, you could ensure with Access that only your company employees can get to your internal kanban board, or lock down the wp-admin of your wordpress site.

Introducing Cloudflare Access: Like BeyondCorp, But You Don’t Have To Be A Google Employee To Use It
Encrypted: As Cloudflare makes all connections secure with HTTPS there is no need for a VPN.

To all the IT administrators who’ve been chastised by a globetrotting executive about how slow the VPN makes the Internet, Access is the perfect solution. It enables you to control and monitor access to applications by providing the following features via the dashboard and APIs:

  • Easily change access policies
  • Modify session durations
  • Revoke existing user sessions
  • Centralized logging for audit and change logs

Want an even faster connection to replace your VPN? Try pairing Access with Argo. If you want to use Access in front of an internal application but don’t want to open up that application to the whole internet, you can combine Access with Warp. Warp will make Cloudflare your application’s internet connection so you don’t even need a public IP. If you want to use Access in front of a legacy application and protect that application from unpatched vulnerabilities in legacy software, you can just click to enable the Web Application Firewall and Cloudflare will inspect packets and block those with exploits.

Cloudflare Access allows employees to connect to corporate applications from any device, any place and on any kind of network. Access is powered by Cloudflare’s global network of 120+ data centers offering adequate redundancy and DDoS protection and proximity to wherever your employees or corporate office might be.

Get Started:

Access takes 5-10 minutes to setup and is free to try for up to one user (beyond that it’s $3 per seat per month, and you can contact sales for bulk discounts). Cloudflare Access is fully available for our enterprise customers today and in open beta for our Free, Pro and Business plan customers. To get started, go to the Access tab of the Cloudflare dashboard.

However improbable: The story of a processor bug

$
0
0

Processor problems have been in the news lately, due to the Meltdown and Spectre vulnerabilities. But generally, engineers writing software assume that computer hardware operates in a reliable, well-understood fashion, and that any problems lie on the software side of the software-hardware divide. Modern processor chips routinely execute many billions of instructions in a second, so any erratic behaviour must be very hard to trigger, or it would quickly become obvious.

But sometimes that assumption of reliable processor hardware doesn’t hold. Last year at Cloudflare, we were affected by a bug in one of Intel’s processor models. Here’s the story of how we found we had a mysterious problem, and how we tracked down the cause.

Sherlock_holmes_pipe_hat-1
CC-BY-SA-3.0 image by Alterego

Prologue

Back in February 2017, Cloudflare disclosed a security problem which became known as Cloudbleed. The bug behind that incident lay in some code that ran on our servers to parse HTML. In certain cases involving invalid HTML, the parser would read data from a region of memory beyond the end of the buffer being parsed. The adjacent memory might contain other customers’ data, which would then be returned in the HTTP response, and the result was Cloudbleed.

But that wasn’t the only consequence of the bug. Sometimes it could lead to an invalid memory read, causing the NGINX process to crash, and we had metrics showing these crashes in the weeks leading up to the discovery of Cloudbleed. So one of the measures we took to prevent such a problem happening again was to require that every crash be investigated in detail.

We acted very swiftly to address Cloudbleed, and so ended the crashes due to that bug, but that did not stop all crashes. We set to work investigating these other crashes.

Crash is not a technical term

But what exactly does “crash” mean in this context? When a processor detects an attempt to access invalid memory (more precisely, an address without a valid page in the page tables), it signals a page fault to the operating system’s kernel. In the case of Linux, these page faults result in the delivery of a SIGSEGV signal to the relevant process (the name SIGSEGV derives from the historical Unix term “segmentation violation”, also known as a segmentation fault or segfault). The default behaviour for SIGSEGV is to terminate the process. It’s this abrupt termination that was one symptom of the Cloudbleed bug.

This possibility of invalid memory access and the resulting termination is mostly relevant to processes written in C or C++. Higher-level compiled languages, such as Go and JVM-based languages, use type systems which prevent the kind of low-level programming errors that can lead to accesses of invalid memory. Furthermore, such languages have sophisticated runtimes that take advantage of page faults for implementation tricks that make them more efficient (a process can install a signal handler for SIGSEGV so that it does not get terminated, and instead can recover from the situation). And for interpreted languages such as Python, the interpreter checks that conditions leading to invalid memory accesses cannot occur. So unhandled SIGSEGV signals tend to be restricted to programming in C and C++.

SIGSEGV is not the only signal that indicates an error in a process and causes termination. We also saw process terminations due to SIGABRT and SIGILL, suggesting other kinds of bugs in our code.

If the only information we had about these terminated NGINX processes was the signal involved, investigating the causes would have been difficult. But there is another feature of Linux (and other Unix-derived operating systems) that provided a path forward: core dumps. A core dump is a file written by the operating system when a process is terminated abruptly. It records the full state of the process at the time it was terminated, allowing post-mortem debugging. The state recorded includes:

  • The processor register values for all threads in the process (the values of some program variables will be held in registers)
  • The contents of the process’ conventional memory regions (giving the values of other program variables and heap data)
  • Descriptions of regions of memory that are read-only mappings of files, such as executables and shared libraries
  • Information associated with the signal that caused termination, such as the address of an attempted memory access that led to a SIGSEGV

Because core dumps record all this state, their size depends upon the program involved, but they can be fairly large. Our NGINX core dumps are often several gigabytes.

Once a core dump has been recorded, it can be inspected using a debugging tool such as gdb. This allows the state from the core dump to be explored in terms of the original program source code, so that you can inquire about the program stack and contents of variables and the heap in a reasonably convenient manner.

A brief aside: Why are core dumps called core dumps? It’s a historical term that originated in the 1960s when the principal form of random access memory was magnetic core memory. At the time, the word core was used as a shorthand for memory, so “core dump” means a dump of the contents of memory.

coremem-2
CC BY-SA 3.0 image by Konstantin Lanzet

The game is afoot

As we examined the core dumps, we were able to track some of them back to more bugs in our code. None of them leaked data as Cloudbleed had, or had other security implications for our customers. Some might have allowed an attacker to try to impact our service, but the core dumps suggested that the bugs were being triggered under innocuous conditions rather than attacks. We didn’t have to fix many such bugs before the number of core dumps being produced had dropped significantly.

But there were still some core dumps being produced on our servers — about one a day across our whole fleet of servers. And finding the root cause of these remaining ones proved more difficult.

We gradually began to suspect that these residual core dumps were not due to bugs in our code. These suspicions arose because we found cases where the state recorded in the core dump did not seem to be possible based on the program code (and in examining these cases, we didn’t rely on the C code, but looked at the machine code produced by the compiler, in case we were dealing with compiler bugs). At first, as we discussed these core dumps among the engineers at Cloudflare, there was some healthy scepticism about the idea that the cause might lie outside of our code, and there was at least one joke about cosmic rays. But as we amassed more and more examples, it became clear that something unusual was going on. Finding yet another “mystery core dump”, as we had taken to calling them, became routine, although the details of these core dumps were diverse, and the code triggering them was spread throughout our code base. The common feature was their apparent impossibility.

There was no obvious pattern to the servers which produced these mystery core dumps. We were getting about one a day on average across our fleet of servers. So the sample size was not very big, but they seemed to be evenly spread across all our servers and datacenters, and no one server was struck twice. The probability that an individual server would get a mystery core dump seemed to be very low (about one per ten years of server uptime, assuming they were indeed equally likely for all our servers). But because of our large number of servers, we got a steady trickle.

In quest of a solution

The rate of mystery core dumps was low enough that it didn’t appreciably impact the service to our customers. But we were still committed to examining every core dump that occurred. Although we got better at recognizing these mystery core dumps, investigating and classifying them was a drain on engineering resources. We wanted to find the root cause and fix it. So we started to consider causes that seemed somewhat plausible:

We looked at hardware problems. Memory errors in particular are a real possibility. But our servers use ECC (Error-Correcting Code) memory which can detect, and in most cases correct, any memory errors that do occur. Furthermore, any memory errors should be recorded in the IPMI logs of the servers. We do see some memory errors on our server fleet, but they were not correlated with the core dumps.

If not memory errors, then could there be a problem with the processor hardware? We mostly use Intel Xeon processors, of various models. These have a good reputation for reliability, and while the rate of core dumps was low, it seemed like it might be too high to be attributed to processor errors. We searched for reports of similar issues, and asked on the grapevine, but didn’t hear about anything that seemed to match our issue.

While we were investigating, an issue with Intel Skylake processors came to light. But at that time we did not have Skylake-based servers in production, and furthermore that issue related to particular code patterns that were not a common feature of our mystery core dumps.

Maybe the core dumps were being incorrectly recorded by the Linux kernel, so that a mundane crash due to a bug in our code ended up looking mysterious? But we didn’t see any patterns in the core dumps that pointed to something like this. Also, upon an unhandled SIGSEGV, the kernel generates a log line with a small amount of information about the cause, like this:

segfault at ffffffff810c644a ip 00005600af22884a sp 00007ffd771b9550 error 15 in nginx-fl[5600aeed2000+e09000]

We checked these log lines against the core dumps, and they were always consistent.

The kernel has a role in controlling the processor’s Memory Management Unit to provide virtual memory to application programs. So kernel bugs in that area can lead to surprising results (and we have encountered such a bug at Cloudflare in a different context). But we examined the kernel code, and searched for reports of relevant bugs against Linux, without finding anything.

For several weeks, our efforts to find the cause were not fruitful. Due to the very low frequency of the mystery core dumps when considered on a per-server basis, we couldn’t follow the usual last-resort approach to problem solving - changing various possible causative factors in the hope that they make the problem more or less likely to occur. We needed another lead.

The solution

But eventually, we noticed something crucial that we had missed until that point: all of the mystery core dumps came from servers containing The Intel Xeon E5-2650 v4. This model belongs to the generation of Intel processors that had the codename “Broadwell”, and it’s the only model of that generation that we use in our edge servers, so we simply call these servers Broadwells. The Broadwells made up about a third of our fleet at that time, and they were in many of our datacenters. This explains why the pattern was not immediately obvious.

This insight immediately threw the focus of our investigation back onto the possibility of processor hardware issues. We downloaded Intel’s Specification Update for this model. In these Specification Update documents Intel discloses all the ways that its processors deviate from their published specifications, whether due to benign discrepancies or bugs in the hardware (Intel entertainingly calls these “errata”).

The Specification Update described 85 issues, most of which are obscure issues of interest mainly to the developers of the BIOS and operating systems. But one caught our eye: “BDF76 An Intel® Hyper-Threading Technology Enabled Processor May Exhibit Internal Parity Errors or Unpredictable System Behavior”. The symptoms described for this issue are very broad (“unpredictable system behavior may occur”), but what we were observing seemed to match the description of this issue better than any other.

Furthermore, the Specification Update stated that BDF76 was fixed in a microcode update. Microcode is firmware that controls the lowest-level operation of the processor, and can be updated by the BIOS (from system vendor) or the OS. Microcode updates can change the behaviour of the processor to some extent (exactly how much is a closely-guarded secret of Intel, although the recent microcode updates to address the Spectre vulnerability give some idea of the impressive degree to which Intel can reconfigure the processor’s behaviour).

The most convenient way for us to apply the microcode update to our Broadwell servers at that time was via a BIOS update from the server vendor. But rolling out a BIOS update to so many servers in so many data centers takes some planning and time to conduct. Due to the low rate of mystery core dumps, we would not know if BDF76 was really the root cause of our problems until a significant fraction of our Broadwell servers had been updated. A couple of weeks of keen anticipation followed while we awaited the outcome.

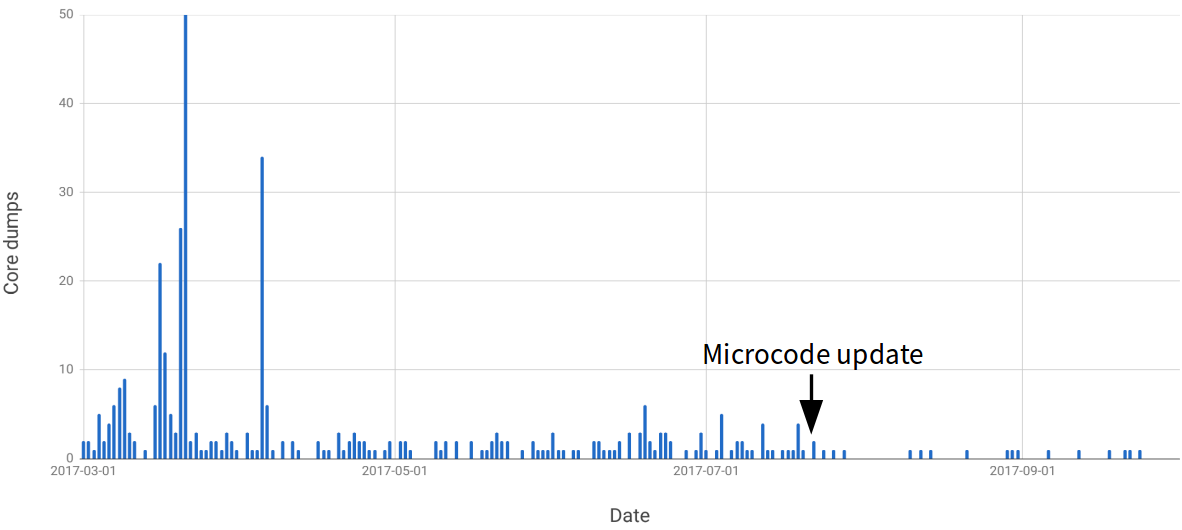
To our great relief, once the update was completed, the mystery core dumps stopped. This chart shows the number of core dumps we were getting each day for the relevant months of 2017:

coredumps

As you can see, after the microcode update there is a marked reduction in the rate of core dumps. But we still get some core dumps. These are not mysteries, but represent conventional issues in our software. We continue to investigate and fix them to ensure they don’t represent security issues in our service.

The conclusion

Eliminating the mystery core dumps has made it easier to focus on any remaining crashes that are due to our code. It removes the temptation to dismiss a core dump because its cause is obscure.

And for some of the core dumps that we see now, understanding the cause can be very challenging. They correspond to very unlikely conditions, and often involve a root cause that is distant from the immediate issue that triggered the core dump. For example, we see segfaults in LuaJIT (which we embed in NGINX via OpenResty) that are not due to problems in LuaJIT, but rather because LuaJIT is particularly susceptible to damage to its data structures by bugs in unrelated C code.

Excited by core dump detective work? Or building systems at a scale where once-in-a-decade problems can get triggered every day? Then join our team.

Deprecating SPDY

$
0
0
Deprecating SPDY

Democratizing the Internet and making new features available to all Cloudflare customers is a core part of what we do. We're proud to be early adopters and have a long record of adopting new standards early, such as HTTP/2, as well as features that are experimental or not yet final, like TLS 1.3 and SPDY.

Participating in the Internet democracy occasionally means that ideas and technologies that were once popular or ubiquitous on the net lose their utility as newer technologies emerge. SPDY is one such technology. Several years ago, Google drafted a proprietary and experimental new protocol called SPDY. SPDY offered many performance improvements over the aging HTTP/1.1 standard and these improvements resulted in significantly faster page load times for real-world websites. Stemming from its success, SPDY became the starting point for HTTP/2 and, when the new HTTP standard was finalized, the SPDY experiment came to an end where it gradually fell into disuse.

As a result, we're announcing our intention to deprecate the use of SPDY for connections made to Cloudflare's edge by February 21st, 2018.

Remembering 2012

Five and a half years ago, when the majority of the web was unencrypted and web developers were resorting to creative tricks to improve performance (such as domain sharding to download resources in parallel) to get around the limitations of the then thirteen-year-old HTTP/1.1 standard, Cloudflare launched support for an exciting new protocol called SPDY.

Deprecating SPDYCC BY-SA 4.0 by Maximilien Brice

SPDY aimed to remove many of the bottlenecks present in HTTP/1.1 by changing the way HTTP requests were sent over the wire. Using header compression, request prioritization, and multiplexing, SPDY was able to provide significant performance gains while remaining compatible with the existing HTTP/1.1 standard. This meant that server operators could place a SPDY layer, such as Cloudflare, in front of their web application and gain the performance benefits of SPDY without modifying any of their existing code. SPDY effectively became a fast tunnel for HTTP traffic.

2015: An ever-changing landscape

As the HTTPbis Working Group submitted SPDY for standardization, the protocol underwent some changes (e.g.— Using HPACK for compression), but retained its core performance optimizations and came to be known as HTTP/2 in May 2015.

With the standardization of HTTP/2, Google announced that they would cease supporting SPDY with the public release of Chrome 51 in May 2016. This signaled to other software providers that they too should abandon support for the experimental SPDY protocol in favor of the newly standardized HTTP/2. Mozilla did so with the release of Firefox 51 in January 2017 and NGINX built their HTTP/2 module so that either it or the SPDY module could be used to terminate HTTPS connections, but not both.

Cloudflare announced support for HTTP/2 in December of 2015. It was at this point that we deviated from our peers in the industry. We knew that adoption of this new standard and the migration away from SPDY would take longer than the 1-2 year timeline put forth by Google and others, so we created our own patch for NGINX so that we could support terminating both SPDY and HTTP/2. This allowed Cloudflare customers who had yet to upgrade their clients to continue to receive the performance benefits of SPDY until they were able to support HTTP/2.

When we made this decision, SPDY was used for 53.59% of TLS connections to our edge and HTTP/2 for 26.79%. Had we only adopted the standard NGINX HTTP/2 module, we would've made the internet around 20% slower for more than half of all visitors to sites on Cloudflare— definitely not a performance compromise we were willing to make!

To 2018 and Beyond

Two years after we began supporting HTTP/2 (and nearly three years after standardization), the majority of web browsers now support HTTP/2 where the notable exceptions are the UC Browser for Android and Opera Mini. This results in SPDY being used for only 3.83% of TLS connections to Cloudflare's edge whereas HTTP/2 accounts for 66.88%. At this point, and for several reasons, now is the time to stop supporting SPDY.

Deprecating SPDYCC0 by JanBaby

Looking closer at the low percentage of clients connecting with SPDY in 2018, 65% of these connections are made by older iOS and macOS apps compiled against HTTP and TLS libraries which only support SPDY and not HTTP/2. This means that these app developers need to publish an update with HTTP/2 support to enable support for this protocol. We worked closely with Apple to assess the impact of deprecating SPDY for these clients and determined that the impact of depreciation is minimal.

We mentioned earlier that we applied our own patch to NGINX in order to be able to continue to support both SPDY and HTTP/2 for TLS connections. What we didn't mention was the engineering cost associated with maintaining this patch. Every time we want to update NGINX, we also need to update and test our patch, which makes each upgrade more difficult. Further, no active development is being done to SPDY so in the event that security issues arise, we would incur the cost of developing our own security patches.

Finally, when we do disable SPDY this February, the less than 4% of traffic that currently uses SPDY will still be able to connect to Cloudflare's edge by gracefully falling back to using HTTP/1.1.

Moving Forward While Looking Back

Part of being an innovator is knowing when it is time to move forward and put older innovations in the rear view mirror. By seeing 10% of HTTP requests made on the internet, Cloudflare is in a unique position to analyze overall adoption trends of new technologies, allowing us to make informed decisions on when to launch new features or deprecate legacy ones.

SPDY has been extraordinarily beneficial to clients connecting to Cloudflare over the years, but now that the protocol is largely abandoned and superseded by newer technologies, we recognize that 2018 is time to say goodbye to an aging legacy protocol.


SYN 패킷 처리 실제​

$
0
0

이 글은 Marek Majkowski가 쓴 최근 글의 번역입니다.

우리 Cloudflare는 실제 인터넷상의 서버 운영 경험이 많지만 이런 흑마술 수련도 게을리하지 않습니다. 이 블로그에서는 인터넷 프로토콜의 여러 어두운 부분을 다룬 적이 있습니다: understanding FIN-WAIT-2receive buffer tuning과 같은 것들입니다.


CC BY 2.0 image by Isaí Moreno

사람들이 충분히 신경쓰지 않는 주제가 하나 있는데, 바로 SYN 홍수(SYN floods) 입니다. 우리는 리눅스를 사용하고 있는데 리눅스에서 SYN 패킷 처리는 매우 복잡하다는 것을 알게 되었습니다. 이 글에서는 이에 대해 좀 더 알아 보도록 하겠습니다.

두개의 큐의 이야기

일단 만들어진 소켓에 대해 "LISTENING" TCP 상태에는 두개의 분리된 큐가 존재 합니다:

  • SYN 큐
  • Accept 큐

일반적으로 이 큐에는 여러가지 다른 이름이 붙어 있는데, "reqsk_queue", "ACK backlog", "listen backlog", "TCP backlog" 등이 있습니다만 혼란을 피하기 위해 위의 이름을 사용하도록 하겠습니다.

SYN 큐

SYN 큐는 수신 SYN 패킷[1] (구체적으로는 struct inet_request_sock)을 저장합니다. 이는 SYN+ACK 패킷을 보내고 타임아웃시에 재시도하는 역할을 합니다. 리눅스에서 재시도 값은 다음과 같이 설정됩니다:

$ sysctl net.ipv4.tcp_synack_retries
net.ipv4.tcp_synack_retries = 5

문서를 보면 다음과 같습니다:

tcp_synack_retries - 정수

    수동 TCP 연결 시도에 대해서 SYNACK를 몇번 다시 보낼지를 지정한다.
    이 값은 255 이하이어야 한다. 기본값은 5이며, 1초의 초기 RTO값을 감안하면
    마지막 재전송은 31초 후에 일어난다. 이는 수동 TCP 연결의 최종 타임아웃은
    63초 이후에 일어난다는 것을 의미한다.

SYN+ACK을 전송한 뒤에 SYN 큐는 3방향 핸드쉐이크의 마지막 단계인 클라이언트로부터의 ACK패킷을 기다립니다. 수신된 ACK 패킷은 모두 완전히 수립된 연결 테이블에서 찾을 수 있어야 하며 관련된 SYN 큐에는 없어야 합니다. SYN 큐에서 찾을 수 있다면, 커널은 해당 연결을 SYN 큐에서 제거하고 완전히 수립된 연결을 만들어 (구체적으로는 struct inet_sock) Accept 큐에 추가합니다.

Accept 큐

Accept 큐는 어플리케이션이 언제라도 가져갈 수 있도록 완전히 수립된 연결을 저장하고 있습니다. 프로세스가 accept()를 부르게 되면 이 큐에서 소켓을 제거하여 어플리케이션에게 전달 합니다.

이는 리눅스에의 SYN 패킷 처리를 매우 간략화한 것인데, TCP_DEFER_ACCEPT[2]TCP_FASTOPEN 의 경우에는 약간 다르게 동작 합니다.

큐 크기 제한

Accept 와 SYN 큐의 최대 크기는 어플리케이션이 호출하는 listen(2) 시스템 콜의 backlog 파라미터로 전달되는 값으로 설정됩니다. 예를 들어 다음은 Accept 와 SYN 큐 크기를 1024로 지정합니다:

listen(sfd, 1024)

참고로 커널 4.3 이전에는 SYN 큐 크기가 다르게 설정되었습니다.

SYN 큐의 최대 크기는 net.ipv4.tcp_max_syn_backlog 에 의해 지정되었지만 더 이상은 그렇지 않습니다. 최근에는 net.core.somaxconn 이 두개의 큐의 최대 크기를 지정합니다. 우리 서버는 16k로 지정하고 있습니다:

$ sysctl net.core.somaxconn
net.core.somaxconn = 16384

적절한 backlog 값

위의 내용을 알고 있다면, 다음과 같은 질문을 할 수 있습니다: 이상적인 backlog 파라미터 값은 얼마인가요?

답은 "그때그때 달라요"입니다. 대부분의 소규모 TCP 서버의 경우 이 값은 그리 중요하지 않습니다. 예를 들어 Go언어는 backlog 값 변경을 지원하지 않고 128로 고정해 놓았습니다. 하지만 이 값을 더 크게 지정해야 할 이유들이 있습니다:

  • 초당 들어오는 연결 수가 매우 많다면 잘 동작하는 어플리케이션이라도 SYN 큐는 많은 패킷을 저장해야 할 수 있습니다.
  • backlog 값은 SYN 큐 크기를 지정합니다. 달리 말하자면 이 값은 "아직 처리되지 않은 ACK 패킷의 수" 이기도 합니다. 클라이언트와의 평균 왕복 시간이 크다면, 더 많은 패킷을 저장할 수 있어야 합니다. 많은 클라이언트가 서버에서 멀리 떨어진 곳에 있다면 (수백밀리초 이상) 이 값을 늘리는 편이 좋을 것입니다.
  • TCP_DEFER_ACCEPT 옵션은 소켓을 SYN-RECV 상태로 더 오래 둘 수 있고 큐 크기에 영향을 미칩니다.

backlog 를 지나치게 크게 지정하는 것도 안좋긴 합니다:

  • SYN 큐는 메모리를 소비 합니다. SYN 홍수시에는 공격 패킷을 저장하기 위해 리소스를 낭비할 필요가 없습니다. SYN 큐의 각각의 struct inet_request_sock 엔트리는 커널 4.14에서 256 바이트의 메모리를 차지 합니다.

리눅스에서 SYN 큐를 들여다보기 위해서는 ss 명령을 이용하여 SYN-RECV 소켓을 살펴 보면 됩니다. 예를 들어 Cloudflare 의 서버 중 하나에서는 다음과 같이 tcp/80 SYN 큐에 119개가, tcp/443에 78개가 쌓여 있음을 알 수 있습니다.

$ ss -n state syn-recv sport = :80 | wc -l
119
$ ss -n state syn-recv sport = :443 | wc -l
78

유사한 데이터를 SystemTap 스크립트 resq.stp를 통해서도 볼 수 있습니다.

느린 어플리케이션

어플리케이션이 accept()를 충분히 빠르게 부르지 못하면 어떻게 될까요?

이때가 바로 마법이 시작될 때입니다! Accept 큐가 꽉 차게 되면 (backlog + 1 크기) 다음과 같은 일이 일어 납니다:

  • SYN 큐로 추가될 수신 SYN 패킷이 버려짐
  • SYN 큐로 추가될 수신 ACK 패킷이 버려짐
  • TcpExtListenOverflows / LINUX_MIB_LISTENOVERFLOWS 카운터가 증가
  • TcpExtListenDrops / LINUX_MIB_LISTENDROPS 카운터가 증가

수신 패킷을 버려도 되는 주된 이유는 이것이 반작용 메카니즘이기 때문입니다. 다시 말하면 상대방은 느린 어플리케이션이 이미 복구되어 있기를 기대하며 SYN이나 ACK 패킷을 언젠가 다시 보내기 때문입니다.

이것은 대부분의 서버에서 바람직한 행동 입니다. 추가로 net.ipv4.tcp_abort_on_overflow 를 지정할 수 있습니다만 바꾸지 않는 편이 좋습니다.

만약 여러분의 서버가 많은 연결을 처리해야 하고 accept() 성능 문제를 겪고 있다면, Nginx tuning / Epoll work distributiona follow up showing useful SystemTap scripts 을 읽어 보세요.

Accept 큐가 넘쳤는지의 통계는 nstat 카운터를 보면 알 수 있습니다.

$ nstat -az TcpExtListenDrops
TcpExtListenDrops     49199     0.0

이 값은 전체 카운터입니다. 모든 어플리케이션이 별 문제 없어 보이는데도 이 값이 증가하는걸 종종 볼 수 있다면 이상적인 상황은 아닐 겁니다. 가장 먼저 할 일은 ss 로 Accept 큐 크기를 살펴보는 겁니다:

$ ss -plnt sport = :6443|cat
State   Recv-Q Send-Q  Local Address:Port  Peer Address:Port
LISTEN  0      1024                *:6443             *:*

Recv-Q 컬럼은 Accept 큐의 소켓 숫자, Send-Q는 backlog 값입니다. 이 경우에는 accept()가 안된 소켓은 아직 없다는 걸 볼 수 있는데, 그래도 ListenDrops 카운터가 증가할 수 있습니다.

우리의 경우 어플리케이션이 아주 잠깐동안만 멈춘 것으로 보입니다. 아주 짧은 시간이라도 멈추기만 한다면 Accept 큐가 넘칠 충분한 이유가 될 겁니다. 바로 뒤에는 복구가 되었을 수 있습니다. 이런 경우라면 ss 로 디버깅하는 건 어렵습니다. 이런 경우를 위해서 acceptq.stp SystemTap 스크립트를 작성하였는데, 커널을 후킹해서 버려지는 SYN 패킷을 출력 합니다:

$ sudo stap -v acceptq.stp
time (us)        acceptq qmax  local addr    remote_addr
1495634198449075  1025   1024  0.0.0.0:6443  10.0.1.92:28585
1495634198449253  1025   1024  0.0.0.0:6443  10.0.1.92:50500
1495634198450062  1025   1024  0.0.0.0:6443  10.0.1.92:65434
...

이제 ListenDrops 에 영향을 미치는 SYN 패킷을 정확하게 알 수 있습니다. 이 스크립트를 통해서 어떤 어플리케이션이 연결을 버리고 있는지 쉽게 알 수 있습니다.


CC BY 2.0 image by internets_dairy

SYN 홍수


Accept 큐를 넘치게 하는게 가능하다면, SYN 큐를 넘치게 하는 것도 가능하겠지요. 어떤 경우일까요?

바로 SYN 홍수 공격 입니다. 예전에는 SYN 큐를 위조된 SYN패킷로 넘치게 하는 것은 큰 문제였습니다. 1996년 이전에는 SYN 큐를 채우는 것 만으로 대부분의 TCP 서버를 매우 적은 대역폭만으로 서비스 불능으로 만들 수 있었습니다.

해결책은 SYN 쿠키입니다. SYN 쿠키는 수신 SYN을 저장하지 않고 메모리 소비 없이 SYN+ACK를 만들 수 있는 방법입니다. SYN 쿠키는 정상적인 트래픽을 방해하지 않습니다. 상대방이 실제 있다면 암호학적으로 확인 가능한 시퀸스 번호를 포함한 정상적인 ACK 패킷을 응답할 것입니다.

기본적으로 SYN 쿠키는 필요할 때 - SYN 큐가 꽉 차 있는 소켓 - 만 사용해야 합니다. 리눅스는 SYN 쿠키에 관련된 몇가지의 카운터를 갖고 있습니다. SYN 쿠키가 발송되는 경우에는:

  • TcpExtTCPReqQFullDoCookies / LINUX_MIB_TCPREQQFULLDOCOOKIES 카운터 증가
  • TcpExtSyncookiesSent / LINUX_MIB_SYNCOOKIESSENT 카운터 증가
  • 리눅스에서는 TcpExtListenDrops 를 증가시켰지만 커널 4.7부터는 아닙니다.

SYN 쿠키가 켜진 상태에서 수신 ACK가 SYN 큐로 들어오게 되면:

  • ACK가 정상적인 값이라면 TcpExtSyncookiesRecv / LINUX_MIB_SYNCOOKIESRECV 카운터 증가
  • 비정상인 경우 TcpExtSyncookiesFailed / LINUX_MIB_SYNCOOKIESFAILED 카운터 증가

net.ipv4.tcp_syncookies sysctl을 통해서 SYN 쿠키를 끄거나 강제로 켜놓을 수 있습니다만 기본 값으로 충분하므로 바꾸지 마세요.

SYN 쿠키와 TCP 타임스탬프

SYN 쿠키 마법은 잘 됩니다만 부작용이 없는 것은 아닙니다. 주된 문제는 SYN 쿠키에 저장할 수 있는 데이터 크기가 작다는 겁니다. 구체적으로는 시퀀스 번호 32비트만이 ACK에 들어 있는데 다음과 같이 나누어서 사용 됩니다:

+----------+--------+-------------------+
|  6 bits  | 2 bits |     24 bits       |
| t mod 32 |  MSS   | hash(ip, port, t) |
+----------+--------+-------------------+

MSS 값을 4가지만 정할 수 있게 되면서 리눅스는 상대방의 다른 TCP 옵션 파라미터를 알 수 없습니다. 타임스탬프, ECN, 선택적인 ACK (SACK), 윈도우 크기 변경 정보를 잃게 되어 TCP 세션 성능을 저하하는 요인이 됩니다.

다행히 리눅스에는 대책이 있습니다. 만약 TCP 타임스탬프가 켜져 있다면, 타임스탬프 필드의 32비트를 다은 용도로 재사용할 수 있습니다. 여기에는 다음 정보가 보관됩니다:

+-----------+-------+-------+--------+
|  26 bits  | 1 bit | 1 bit | 4 bits |
| Timestamp |  ECN  | SACK  | WScale |
+-----------+-------+-------+--------+

TCP 타임스탬프는 기본적으로 켜져 있을 것입니다. 확인해 보기 위해 sysctl을 봅시다:

$ sysctl net.ipv4.tcp_timestamps
net.ipv4.tcp_timestamps = 1

예전부터 TCP 타임스탬프의 유용성에 대해 많은 논의가 있었습니다.

  • 과거에 타임스탬프가 서버 가동 시간을 유출하는 경우가 있었습니다 (얼마나 이것이 중요한지는 다른 문제입니다만) 이것은 8개월 전에 수정되었습니다.
  • TCP 타임스탬프는 대역폭을 꽤 소모합니다 - 패킷당 12 바이트
  • 패킷 체크섬에 일정부분 임의의 데이터를 추가하게 되어 일부 잘못된 하드웨어에 도움이 됩니다.
  • 위에서 이야기한 것 처럼 SYN 쿠키가 동작하는 경우 TCP 타임스탬프는 TCP 연결의 성능 향상에 도움이 됩니다.

현재 Cloudflare 에서는 TCP 타임스탬프를 꺼두고 있습니다.

마지막으로 SYN 쿠키가 동작하는 경우 TCP_SAVED_SYN, TCP_DEFER_ACCEPT, TCP_FAST_OPEN과 같은 멋진 기능이 동작하지 않습니다.

Cloudflare 스케일의 SYN 홍수

SYN 쿠키는 위대한 발명이고 소규모의 SYN 홍수의 문제를 해결해 줍니다. 하지만 Cloudflare 에서는 이를 최대한 사용하지 않으려 합니다. 초당 암호학적으로 확인 가능한 수천의 SYN+ACK를 보내는 것은 괜찮지만, 우리는 초당 2억 패킷 이상의 공격을 받고 있습니다. 이런 규모의 경우 SYN+ACK 응답은 쓸모 없는 패킷만 양산할 뿐 대부분 의미가 없습니다.

대신 우리는 파이어월 단에서 악의적인 SYN 패킷을 차단하려 하고 있으며 현재 BPF에 컴파일된 p0f SYN 지문을 이용하고 있습니다. 자세한 내용은 Introducing the p0f BPF compiler를 읽어 보기 바랍니다. 이런 공격을 찾아내고 방어하기 위해 우리는 "Gatebot"이라 불리는 자동화 시스템을 개발하였습니다. 이에 대해서는 다음 글을 읽어 보세요: Meet Gatebot - the bot that allows us to sleep

발전하는 환경

약간 오래 되었지만 관련된 주제에 대한 상세한 내용은 2015년 Andreas Veithen의 훌륭한 설명2013년 Gerald W. Gordon의 상세한 논문을 참조 하세요.

리눅스 SYN 패킷 처리 환경은 계속 발전하고 있습니다. 최근까지만 해도 SYN 쿠키는 커널의 오래된 잠금 때문에 느렸습니다. 이 문제는 4.4에서 수정되었고 이제 커널은 초당 수백만의 SYN 쿠키를 보낼 수 있어서 대부분의 경우 SYN 홍수 문제는 실질적으로 해결되었습니다. 적절한 튜닝을 통해 정상적인 연결의 성능을 방해하지 않고 아주 귀찮은 SYN 홍수를 방어할 수 있습니다.

어플리케이션 성능도 많은 관심을 끌고 있습니다. SO_ATTACH_REUSEPORT_EBPF 과 같은 아이디어는 네트워크 스택을 프로그래밍할 수 있는 새로운 계층을 제공합니다

운영체제의 잘 바뀌지 않던 부분인 네트워킹 스택에 혁신과 새로운 아이디어가 들어가고 있다는 것은 좋은 일입니다.

이 글에 도움을 준 Binh Le에게 감사드립니다.


리눅스와 NGINX 내부에 흥미가 있는지요? 런던, 오스틴, 샌프란시스코 및 폴란드 바르샤바의 세계 최고 수준의 팀에 합류 하세요.


  1. 단순하게 이야기하였지만 SYN 큐는 아직 성립되지 않은 연결을 저장하지 SYN 패킷 자체를 저장하는게 아닙니다.TCP_SAVE_SYN이라면 비슷하겠지만. ↩︎

  2. TCP_DEFER_ACCEPT 를 처음 접한다면 FreeBSD의 accept filters를 알아 보세요. ↩︎

Web Cache Deception Attack revisited

$
0
0

In April, we wrote about Web Cache Deception attacks, and how our customers can avoid them using origin configuration.

Read that blog post to learn about how to configure your website, and for those who are not able to do that, how to disable caching for certain URIs to prevent this type of attacks. Since our previous blog post, we have looked for but have not seen any large scale attacks like this in the wild.

Today, we have released a tool to help our customers make sure only assets that should be cached are being cached.

A brief re-introduction to Web Cache Deception attack

Recall that the Web Cache Deception attack happens when an attacker tricks a user into clicking a link in the format of http://www.example.com/newsfeed/foo.jpg, when http://www.example.com/newsfeed is the location of a dynamic script that returns different content for different users. For some website configurations (default in Apache but not in nginx), this would invoke /newsfeed with PATH_INFO set to /foo.jpg. If http://www.example.com/newsfeed/foo.jpg does not return the proper Cache-Control headers to tell a web cache not to cache the content, web caches may decide to cache the result based on the extension of the URL. The attacker can then visit the same URL and retrieve the cached content of a private page.

The proper fix for this is to configure your website to either reject requests with the extra PATH_INFO or to return the proper Cache-Control header. Sometimes our customers are not able to do that (maybe the website is running third-party software that they do not fully control), and they can apply a Bypass Cache Page Rule for those script locations.

Cache Deception Armor

black and white portrait of a man in Medieval armor, getting ready to swing a sword.
Photo by Henry Hustava / Unsplash

The new Cache Deception Armor Page Rule protects customers from Web Cache Deception attacks while still allowing static assets to be cached. It verifies that the URL's extension matches the returned Content-Type. In the above example, if http://www.example.com/newsfeed is a script that outputs a web page, the Content-Type is text/html. On the other hand, http://www.example.com/newsfeed/foo.jpg is expected to have image/jpeg as Content-Type. When we see a mismatch that could result in a Web Cache Deception attack, we will not cache the response.

There are some exceptions to this. For example if the returned Content-Type is application/octet-stream we don't care what the extension is, because that's typically a signal to instruct the browser to save the asset instead of to display it. We also allow .jpg to be served as image/webp or .gif as video/webm and other cases that we think are unlikely to be attacks.

This new Page Rule depends upon Origin Cache Control. A Cache-Control header from the origin or Edge Cache TTL Page Rule will override this protection.

Large drop in traffic from the Democratic Republic of Congo

$
0
0

It is not uncommon for countries around the world to interrupt Internet access for political reasons or because of social unrest. We've seen this many times in the past (e.g. Gabon, Syria, Togo).

Today, it appears that Internet access in the Democratic Republic of Congo has been greatly curtailed. The BBC reports that Internet access in the capital, Kinshasa was cut on Saturday and iAfrikan reports that the cut is because of anti-Kabila protests.

Our monitoring of traffic from the Democratic Republic of Congo shows a distinct drop off starting around midnight UTC on January 21, 2018. Traffic is down to about 1/3 of its usual level.

Screen-Shot-2018-01-22-at-10.33.58-1

We'll update this blog once we have more information about traffic levels.

Lessons learned from adapting Site Search 360 for Cloudflare Apps

$
0
0
Lessons learned from adapting Site Search 360 for Cloudflare Apps

This is a guest post by David Urbansky, CEO and Co-Founder of SEMKNOX and Site Search 360. David is a search enthusiast having built natural language search experiences for e-commerce sites and recipe search engines.

As a startup founder, there are always key product decisions to be made when Site Search 360, our key product, is embedded in one context versus another. I’d like to share some experiences, choices, and challenges in our process packaging Site Search 360 for Cloudflare Apps.

What is Site Search 360?

Site Search 360 is a search solution for websites. Offering a search bar on a website improves user experience tremendously if the site has more than just a handful of pages. According to a eConsultancy study, up to 30% of web visitors use the search feature on e-commerce sites and searchers sometimes make up 40% of the revenue. Additionally, Nielsen Group found that 51% of people who did not find what they were looking for with the first query, gave up without refining the search - the search had better work very well then.

Lessons learned from adapting Site Search 360 for Cloudflare Apps

Why use the Cloudflare App?

Considering these facts, almost every website should have a search feature. However, implementing that functionality is not trivial. Developers are faced with multiple non-obvious decisions to make, such as:

  • What content should and should not be indexed (do you need the header and footer of every page in the index? Probably not!)
  • How do I keep my index up to date when I add new pages or change something?
  • What storage engine should I use and how do I handle complex queries?
  • How to maintin the additional codebase, especially if non-technical leadership wants to change a decision on what to index?

Thus, for most sites, a highly customizable off-the-shelf search solution is the fastest and lowest maintenance way to go. Site Search 360 offers that along with additional features, such as:

  • Autocomplete and search suggestions
  • High speed
  • Mobile capability
  • Full control over search results
  • Analytics about user behavior and search trends

In-depth configuration

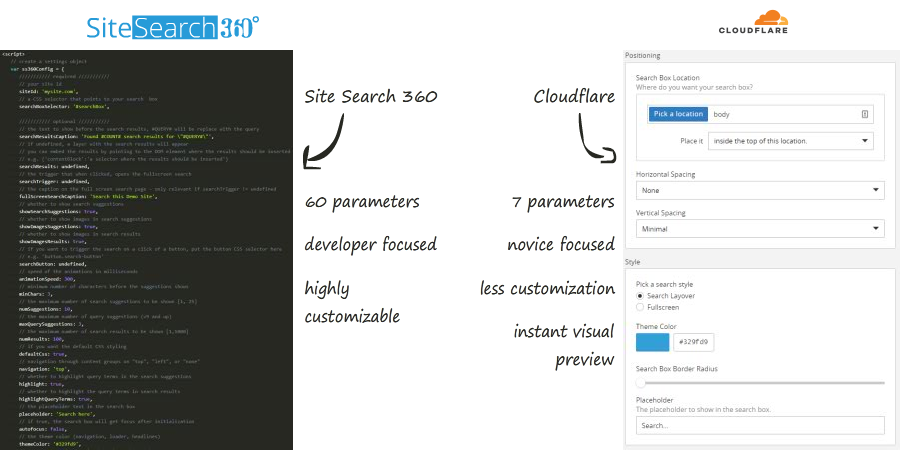
To make a search solution fit perfectly into the style and theme of a website, one has to be able to customize it. Site Search 360 offers over 60 parameters developers can tinker with to make the search behave and consistently fit the brand and style of the rest of the site.

Cloudflare Apps are configured visually though, and 60 input fields, radio buttons, check lists, select boxes, and sliders would be too much for the average Cloudflare user. Applying the Pareto Principle, we were able to identify the 7 parameters most frequently used that have the highest impact on a website's look and feel. We chose these for our Cloudflare app.

Lessons learned from adapting Site Search 360 for Cloudflare Apps

Experience developing the Cloudflare Apps

We have integrated Site Search 360 with other platforms, such as Zapier (read more), Integromat, WordPress,and Drupal, so we’ve seen multiple interfaces and experienced many different processes of getting an integration working and approved.

Where Cloudflare stood out is the declaration-driven approach to app development. Using only the form elements provided by Cloudflare required us to think about how to map our configuration parameters to Cloudflare components and make them as simple as possible. Just this process alone made us reconsider some of our configuration options and how we could make them easier to use, even outside the Cloudflare use case. For example, instead of letting the user choose between a set of icons for the search bar, we opted for picking one. This allowed us to embed it directly in CSS and minimize the CSS file size that would otherwise get considerably bigger with every Base64 encoded icon choice we could have provided.

The single best thing I have to say about the process is the support. No matter how good the documentation, developers always have questions, so it was crucial for us that we could get quick and thorough feedback every step along the way. Cloudflare takes the approval process very seriously and only allows high quality apps into their store. Their eye for detail challenged us to go back to the drawing board more than once and rethink certain design choices, e.g. did we really need sliders for the margin of an element or can we simplify it to a choice between "none", "little", and "more"?

Challenges

We encountered two main challenges:

  • jQuery had to die: Since we have no idea on which of 7+ million sites the Cloudflare app will be installed we had to move away from jQuery completely to avoid possible conflicts. This is another example of a push that came through the platform that benefits our product also outside of Cloudflare.
  • Account & Sign Up: In order for the user to see the search working, we have to have some indexed data. However, if a user without a Cloudflare account just previews the app, there is no indexed data. We therefore created a preview account that shows search results from Wikipedia, making registration unnecessary to preview the app.

Preview Site Search 360 on any site with Cloudflare Apps »

If you have questions or feedback, it is easy to reach us in Site Search 360’s community chat, via Twitter @sitesearch, or by email mail@sitesearch360.com.

Happy Searching!

SEO Performance in 2018 Using Cloudflare

$
0
0
SEO Performance in 2018 Using Cloudflare

For some businesses SEO is a bad word, and for good reason. Google and other search engines keep their algorithms a well-guarded secret making SEO implementation not unlike playing a game where the referee won’t tell you all the rules. While SEO experts exist, the ambiguity around search creates an opening for grandiose claims and misinformation by unscrupulous profiteers claiming expertise.

If you’ve done SEO research, you may have come across an admixture of legitimate SEO practices, outdated optimizations, and misguided advice. You might have read that using the keyword meta tag in your HTML will help your SEO (it won’t), that there’s a specific number of instances a keyword should occur on a webpage (there isn’t), or that buying links will improve your rankings (it likely won’t and will get the site penalized). Let’s sift through the noise and highlight some dos and don’ts for performance-based SEO in 2018.

SEO is dead, long live SEO!

Nearly every year since its inception, SEO is declared dead. It is true that the scope of best practices for search engines has narrowed over the years as search engines have become smarter, and much of the benefit from SEO can be experienced by following these two rules:

  1. Create good content
  2. Don’t be creepy

Beyond the fairly obvious, there are a number of tactics that can help improve the importance with which a website is evaluated inside Google, Bing and others. This blog will focus on optimizing for Google, though the principles and practices likely apply to all search engines.

Does using Cloudflare hurt my SEO?

The short answer is, no. When asked whether or not Cloudflare can damage search rankings, John Mueller from Google stated CDNs can work great for both users and search engines when properly configured. This is consistent with our findings at Cloudflare, as we have millions of web properties, including SEO agencies, who use our service to improve both performance and SEO.

Can load time affect a site's SEO ranking?

Yes, it can. Since at least 2010, Google has publicly stated that site speed affects your Google ranking. While most sites at that time were not affected, times have changed and heavier sites with frontend frameworks, images, CMS platforms and/or a slew of other javascript dependencies are the new normal. Google promotes websites that result in a good user experience, and slow sites are frustrating and penalized in rankings as a result.

The cost of slow websites on user experience is particularly dramatic in mobile, where limited bandwidth results in further constraints. Aside from low search rankings, slow loading sites result in bad outcomes; research by Google indicates 53% of mobile sites are abandoned if load time is more than 3 seconds. Separate research from Google using a deep neural network found that as a mobile site’s load time goes from 1 to 7 seconds, the probability of a visitor bouncing increases 113%. The problems surrounding page speed increase the longer a site takes to load; mobile sites that load in 5 seconds earn 2x more ad revenue than those that take 19 seconds to load (the average time to completely load a site on a 3G connection).

What tools can I use to evaluate my site's performance?

A number of free and verified tools are available for checking a website’s performance. Based on Google’s research, you can estimate the number of visitors you will lose due to excessive loading time on mobile. Not to sound click baitey, but the results may surprise you.

As more web traffic continues to shift to mobile, mobile optimization must be prioritized for most websites. Google has announced that in July 2018 mobile speed will also affect SEO placement. If you want to do more research on your site’s overall mobile readiness, you can check to see if your site is mobile friendly.

If you’re technically-minded and use Chrome, you can pop into the Chrome devtools and click on the audits tab to access Lighthouse, Chrome’s built in analysis tool.
SEO Performance in 2018 Using Cloudflare

Other key metrics used for judging your site's performance include FCP and DCL speeds. First Contentful Paint (FCP) measures the first moment content is loaded onto the screen of the user, answering the user’s question: “is this useful?”. The other metric, DOM Content Loaded (DCL), measures when all stylesheets have loaded and the DOM tree is able to be rendered. Google provides a tool for you to measure your website’s FCP and DCL speeds relative to other sites.

Can spammy websites hosted on the same platform hurt SEO?

Generally speaking, there is no cause for concern as shared hosts shouldn’t hurt your SEO, even if some of the sites on the shared host are less reputable. In the unlikely event you find yourself as the only legitimate website on the host that is almost entirely spam, it might be time to rethink your hosting strategy.

Does downtime hurt SEO?

If your site is down when it’s crawled, it may be temporarily pulled from results. This is why service interruptions such as getting DDoSed during peak purchases times can be more damaging. Typically a site’s ranking will recover when it comes back online. If it’s down for an entire day it may take up to a few weeks to recover.

Don’t be creepy in SEO: an incomplete guide

Everybody likes to win, but playing outside the rules can have consequences. For websites that attempt to circumvent Google’s guidelines in an attempt to trick the search algorithms and web crawlers, a perilous future awaits. Here are a few things that you should make sure you avoid.

Permitting user-generated spam - sometimes unmoderated comment sections run amok with user generated spam ads, complete with links to online pharmacies and other unrelated topics. Leaving these types of links in place lowers the quality of your content and may subject you to penalization. Having trouble handling a spam situation? There are strategies you can implement.

Link schemes - while sharing links with reputable sources is still a legitimate tactic, excessively sharing links is not. Likewise, purchasing large bundles of links in an attempt to boost SEO by artificially passing PageRank is best avoided. There are many link schemes, and if you’re curious whether or not you’re in violation, look at Google’s documentation. If you feel like you might’ve made questionable link decisions in the past and you want to undo them, you can disavow links that point to your site, but use this feature with extreme caution.

Doorway pages - By creating many pages that optimize for specific search phrases, but ultimately point to the same page, some sites attempt to saturate all the search terms around a particular topic. While this might be tempting strategy to gain a lot of SEO very quickly, it may result in all pages losing rank.

Scraping content - In an attempt to artificially build content, some websites will scrape content from other reputable sources and call it their own. Aside from the fact that this behavior can get a site flagged by the Panda algorithm for unrelated or excessive content, it is also in violation of the guidelines and can result in penalization or removal of a website from results.

Hidden text and links - by hiding text inside a webpage so it’s not visible to users, some websites will try to artificially increment the amount of content they have on their site or the amount of instances a keyword occurs. Hiding text behind an image, setting a font size to zero, using CSS to position an element off of the screen, or the classic “white text on a white background” are all tactics to be avoided.

Sneaky redirects - as the name implies, it’s possible to surreptitiously redirect users from the result that they were expecting onto something different. Split cases can also occur where a desktop version of the site will be directed to the intended page while the mobile will be forwarded to full-screen advertising.

Cloaking - by attempting to show different content to search engines and users, some sites will attempt to circumvent the processes a search engine has in place to filter out low value content. While cloaking might have a cool name, it’s in violation and can result in rank reduction or listing removal.

What SEO resources does Google provide?

There are number of sources that can be considered authoritative when it comes to Google SEO. John Mueller, Gary Illyes and (formerly) Matt Cutts, collectively represent a large portion of the official voice of Google search and provide much of the official SEO best practices content. Aside from the videos, blogs, office hours, and other content provided by these experts, Google also provides the Google webmaster blog and Google search console which house various resources and updates.

Last but not least, if you have web properties currently on Cloudflare there are technical optimizations you can make to improve your SEO.

Writing complex macros in Rust: Reverse Polish Notation

$
0
0
Writing complex macros in Rust: Reverse Polish Notation

(This is a crosspost of a tutorial originally published on my personal blog)

Among other interesting features, Rust has a powerful macro system. Unfortunately, even after reading The Book and various tutorials, when it came to trying to implement a macro which involved processing complex lists of different elements, I still struggled to understand how it should be done, and it took some time till I got to that "ding" moment and started misusing macros for everything :) (ok, not everything as in the i-am-using-macros-because-i-dont-want-to-use-functions-and-specify-types-and-lifetimes everything like I've seen some people do, but anywhere it's actually useful)

Writing complex macros in Rust: Reverse Polish Notation
CC BY 2.0 image by Conor Lawless

So, here is my take on describing the principles behind writing such macros. It assumes you have read the Macros section from The Book and are familiar with basic macros definitions and token types.

I'll take a Reverse Polish Notation as an example for this tutorial. It's interesting because it's simple enough, you might be already familiar with it from school, and yet to implement it statically at compile time, you already need to use a recursive macros approach.

Reverse Polish Notation (also called postfix notation) uses a stack for all its operations, so that any operand is pushed onto the stack, and any [binary] operator takes two operands from the stack, evaluates the result and puts it back. So an expression like following:

2 3 + 4 *

translates into:

  1. Put 2 onto the stack.
  2. Put 3 onto the stack.
  3. Take two last values from the stack (3 and 2), apply operator + and put the result (5) back onto the stack.
  4. Put 4 onto the stack.
  5. Take two last values from the stack (4 and 5), apply operator * (4 * 5) and put the result (20) back onto the stack.
  6. End of expression, the single value on the stack is the result (20).

In a more common infix notation, used in math and most modern programming languages, the expression would look like (2 + 3) * 4.

So let's write a macro that would evaluate RPN at compile-time by converting it into an infix notation that Rust understands.

macro_rules! rpn {
  // TODO
}

println!("{}", rpn!(2 3 + 4 *)); // 20

Let's start with pushing numbers onto the stack.

Macros currently don't allow matching literals, and expr won't work for us because it can accidentally match sequence like 2 + 3 ... instead of taking just a single number, so we'll resort to tt - a generic token matcher that matches only one token tree (whether it's a primitive token like literal/identifier/lifetime/etc. or a ()/[]/{}-parenthesized expression containing more tokens):

macro_rules! rpn {
  ($num:tt) => {
    // TODO
  };
}

Now, we'll need a variable for the stack.

Macros can't use real variables, because we want this stack to exist only at compile time. So, instead, the trick is to have a separate token sequence that can be passed around, and so used as kind of an accumulator.

In our case, let's represent it as a comma-separated sequence of expr (since we will be using it not only for simple numbers but also for intermediate infix expressions) and wrap it into brackets to separate from the rest of the input:

macro_rules! rpn {
  ([ $($stack:expr),* ] $num:tt) => {
    // TODO
  };
}

Now, a token sequence is not really a variable - you can't modify it in-place and do something afterwards. Instead, you can create a new copy of this token sequence with necessary modifications, and recursively call same macro again.

If you are coming from functional language background or worked with any library providing immutable data before, both of these approaches - mutating data by creating a modified copy and processing lists with a recursion - are likely already familiar to you:

macro_rules! rpn {
  ([ $($stack:expr),* ] $num:tt) => {
    rpn!([ $num $(, $stack)* ])
  };
}

Now, obviously, the case with just a single number is rather unlikely and not very interesting to us, so we'll need to match anything else after that number as a sequence of zero or more tt tokens, which can be passed to next invocation of our macro for further matching and processing:

macro_rules! rpn {
  ([ $($stack:expr),* ] $num:tt $($rest:tt)*) => {
      rpn!([ $num $(, $stack)* ] $($rest)*)
  };
}

At this point we're still missing operator support. How do we match operators?

If our RPN would be a sequence of tokens that we would want to process in an exactly same way, we could simply use a list like $($token:tt)*. Unfortunately, that wouldn't give us an ability to go through list and either push an operand or apply an operator depending on each token.

The Book says that "macro system does not deal with parse ambiguity at all", and that's true for a single macros branch - we can't match a sequence of numbers followed by an operator like $($num:tt)* + because + is also a valid token and could be matched by the tt group, but this is where recursive macros helps again.

If you have different branches in your macro definition, Rust will try them one by one, so we can put our operator branches before the numeric one and, this way, avoid any conflict:

macro_rules! rpn {
  ([ $($stack:expr),* ] + $($rest:tt)*) => {
    // TODO
  };

  ([ $($stack:expr),* ] - $($rest:tt)*) => {
    // TODO
  };

  ([ $($stack:expr),* ] * $($rest:tt)*) => {
    // TODO
  };

  ([ $($stack:expr),* ] / $($rest:tt)*) => {
    // TODO
  };

  ([ $($stack:expr),* ] $num:tt $($rest:tt)*) => {
    rpn!([ $num $(, $stack)* ] $($rest)*)
  };
}

As I said earlier, operators are applied to the last two numbers on the stack, so we'll need to match them separately, "evaluate" the result (construct a regular infix expression) and put it back:

macro_rules! rpn {
  ([ $b:expr, $a:expr $(, $stack:expr)* ] + $($rest:tt)*) => {
    rpn!([ $a + $b $(, $stack)* ] $($rest)*)
  };

  ([ $b:expr, $a:expr $(, $stack:expr)* ] - $($rest:tt)*) => {
    rpn!([ $a - $b $(, $stack)* ] $($rest)*)
  };

  ([ $b:expr, $a:expr $(, $stack:expr)* ] * $($rest:tt)*) => {
    rpn!([ $a * $b $(,$stack)* ] $($rest)*)
  };

  ([ $b:expr, $a:expr $(, $stack:expr)* ] / $($rest:tt)*) => {
    rpn!([ $a / $b $(,$stack)* ] $($rest)*)
  };

  ([ $($stack:expr),* ] $num:tt $($rest:tt)*) => {
    rpn!([ $num $(, $stack)* ] $($rest)*)
  };
}

I'm not really fan of such obvious repetitions, but, just like with literals, there is no special token type to match operators.

What we can do, however, is add a helper that would be responsible for the evaluation, and delegate any explicit operator branch to it.

In macros, you can't really use an external helper, but the only thing you can be sure about is that your macros is already in scope, so the usual trick is to have a branch in the same macro "marked" with some unique token sequence, and call it recursively like we did in regular branches.

Let's use @op as such marker, and accept any operator via tt inside it (tt would be unambiguous in such context because we'll be passing only operators to this helper).

And the stack does not need to be expanded in each separate branch anymore - since we wrapped it into [] brackets earlier, it can be matched as any another token tree (tt), and then passed into our helper:

macro_rules! rpn {
  (@op [ $b:expr, $a:expr $(, $stack:expr)* ] $op:tt $($rest:tt)*) => {
    rpn!([ $a $op $b $(, $stack)* ] $($rest)*)
  };

  ($stack:tt + $($rest:tt)*) => {
    rpn!(@op $stack + $($rest)*)
  };

  ($stack:tt - $($rest:tt)*) => {
    rpn!(@op $stack - $($rest)*)
  };

  ($stack:tt * $($rest:tt)*) => {
    rpn!(@op $stack * $($rest)*)
  };

  ($stack:tt / $($rest:tt)*) => {
    rpn!(@op $stack / $($rest)*)
  };

  ([ $($stack:expr),* ] $num:tt $($rest:tt)*) => {
    rpn!([ $num $(, $stack)* ] $($rest)*)
  };
}

Now any tokens are processed by corresponding branches, and we need to just handle final case when stack contains a single item, and no more tokens are left:

macro_rules! rpn {
  // ...

  ([ $result:expr ]) => {
    $result
  };
}

At this point, if you invoke this macro with an empty stack and RPN expression, it will already produce a correct result:

Playground

println!("{}", rpn!([] 2 3 + 4 *)); // 20

However, our stack is an implementation detail and we really wouldn't want every consumer to pass an empty stack in, so let's add another catch-all branch in the end that would serve as an entry point and add [] automatically:

Playground

macro_rules! rpn {
  // ...

  ($($tokens:tt)*) => {
    rpn!([] $($tokens)*)
  };
}

println!("{}", rpn!(2 3 + 4 *)); // 20

Our macro even works for more complex expressions, like the one from Wikipedia page about RPN!

println!("{}", rpn!(15 7 1 1 + - / 3 * 2 1 1 + + -)); // 5

Error handling

Now everything seems to work smoothly for correct RPN expressions, but for a macros to be production-ready we need to be sure that it can handle invalid input as well, with a reasonable error message.

First, let's try to insert another number in the middle and see what happens:

println!("{}", rpn!(2 3 7 + 4 *));

Output:

error[E0277]: the trait bound `[{integer}; 2]: std::fmt::Display` is not satisfied
  --> src/main.rs:36:20
   |
36 |     println!("{}", rpn!(2 3 7 + 4 *));
   |                    ^^^^^^^^^^^^^^^^^ `[{integer}; 2]` cannot be formatted with the default formatter; try using `:?` instead if you are using a format string
   |
   = help: the trait `std::fmt::Display` is not implemented for `[{integer}; 2]`
   = note: required by `std::fmt::Display::fmt`

Okay, that definitely doesn't look helpful as it doesn't provide any information relevant to the actual mistake in the expression.

In order to figure out what happened, we will need to debug our macros. For that, we'll use a trace_macros feature (and, like for any other optional compiler feature, you'll need a nightly version of Rust). We don't want to trace println! call, so we'll separate our RPN calculation to a variable:

Playground

#![feature(trace_macros)]

macro_rules! rpn { /* ... */ }

fn main() {
  trace_macros!(true);
  let e = rpn!(2 3 7 + 4 *);
  trace_macros!(false);
  println!("{}", e);
}

In the output we'll now see how our macro is being recursively evaluated step by step:

note: trace_macro
  --> src/main.rs:39:13
   |
39 |     let e = rpn!(2 3 7 + 4 *);
   |             ^^^^^^^^^^^^^^^^^
   |
   = note: expanding `rpn! { 2 3 7 + 4 * }`
   = note: to `rpn ! ( [  ] 2 3 7 + 4 * )`
   = note: expanding `rpn! { [  ] 2 3 7 + 4 * }`
   = note: to `rpn ! ( [ 2 ] 3 7 + 4 * )`
   = note: expanding `rpn! { [ 2 ] 3 7 + 4 * }`
   = note: to `rpn ! ( [ 3 , 2 ] 7 + 4 * )`
   = note: expanding `rpn! { [ 3 , 2 ] 7 + 4 * }`
   = note: to `rpn ! ( [ 7 , 3 , 2 ] + 4 * )`
   = note: expanding `rpn! { [ 7 , 3 , 2 ] + 4 * }`
   = note: to `rpn ! ( @ op [ 7 , 3 , 2 ] + 4 * )`
   = note: expanding `rpn! { @ op [ 7 , 3 , 2 ] + 4 * }`
   = note: to `rpn ! ( [ 3 + 7 , 2 ] 4 * )`
   = note: expanding `rpn! { [ 3 + 7 , 2 ] 4 * }`
   = note: to `rpn ! ( [ 4 , 3 + 7 , 2 ] * )`
   = note: expanding `rpn! { [ 4 , 3 + 7 , 2 ] * }`
   = note: to `rpn ! ( @ op [ 4 , 3 + 7 , 2 ] * )`
   = note: expanding `rpn! { @ op [ 4 , 3 + 7 , 2 ] * }`
   = note: to `rpn ! ( [ 3 + 7 * 4 , 2 ] )`
   = note: expanding `rpn! { [ 3 + 7 * 4 , 2 ] }`
   = note: to `rpn ! ( [  ] [ 3 + 7 * 4 , 2 ] )`
   = note: expanding `rpn! { [  ] [ 3 + 7 * 4 , 2 ] }`
   = note: to `rpn ! ( [ [ 3 + 7 * 4 , 2 ] ] )`
   = note: expanding `rpn! { [ [ 3 + 7 * 4 , 2 ] ] }`
   = note: to `[(3 + 7) * 4, 2]`

If we carefully look through the trace, we'll notice that the problem originates in these steps:

   = note: expanding `rpn! { [ 3 + 7 * 4 , 2 ] }`
   = note: to `rpn ! ( [  ] [ 3 + 7 * 4 , 2 ] )`

Since [ 3 + 7 * 4 , 2 ] was not matched by ([$result:expr]) => ... branch as a final expression, it was caught by our final catch-all ($($tokens:tt)*) => ... branch instead, prepended with an empty stack [] and then the original [ 3 + 7 * 4 , 2 ] was matched by generic $num:tt and pushed onto the stack as a single final value.

In order to prevent this from happening, let's insert another branch between these last two that would match any stack.

It would be hit only when we ran out of tokens, but stack didn't have exactly one final value, so we can treat it as a compile error and produce a more helpful error message using a built-in compile_error! macro.

Note that we can't use format! in this context since it uses runtime APIs to format a string, and instead we'll have to limit ourselves to built-in concat! and stringify! macros to format a message:

Playground

macro_rules! rpn {
  // ...

  ([ $result:expr ]) => {
    $result
  };

  ([ $($stack:expr),* ]) => {
    compile_error!(concat!(
      "Could not find final value for the expression, perhaps you missed an operator? Final stack: ",
      stringify!([ $($stack),* ])
    ))
  };

  ($($tokens:tt)*) => {
    rpn!([] $($tokens)*)
  };
}

The error message is now more meaningful and contains at least some details about current state of evaluation:

error: Could not find final value for the expression, perhaps you missed an operator? Final stack: [ (3 + 7) * 4 , 2 ]
  --> src/main.rs:31:9
   |
31 |         compile_error!(concat!("Could not find final value for the expression, perhaps you missed an operator? Final stack: ", stringify!([$($stack),*])))
   |         ^^^^^^^^^^^^^^^^^^^^^^^^^^^^^^^^^^^^^^^^^^^^^^^^^^^^^^^^^^^^^^^^^^^^^^^^^^^^^^^^^^^^^^^^^^^^^^^^^^^^^^^^^^^^^^^^^^^^^^^^^^^^^^^^^^^^^^^^^^^^^^^^^^
...
40 |     println!("{}", rpn!(2 3 7 + 4 *));
   |                    ----------------- in this macro invocation

But what if, instead, we miss some number?

Playground

println!("{}", rpn!(2 3 + *));

Unfortunately, this one is still not too helpful:

error: expected expression, found `@`
  --> src/main.rs:15:14
   |
15 |         rpn!(@op $stack * $($rest)*)
   |              ^
...
40 |     println!("{}", rpn!(2 3 + *));
   |                    ------------- in this macro invocation

If you try to use trace_macros, even it won't expand the stack here for some reason, but, luckily, it's relatively clear what's going on - @op has very specific conditions as to what should be matched (it expects at least two values on the stack), and, when it can't, @ gets matched by the same way-too-greedy $num:tt and pushed onto the stack.

To avoid this, again, we'll add another branch to match anything starting with @op that wasn't matched already, and produce a compile error:

Playground

macro_rules! rpn {
  (@op [ $b:expr, $a:expr $(, $stack:expr)* ] $op:tt $($rest:tt)*) => {
    rpn!([ $a $op $b $(, $stack)* ] $($rest)*)
  };

  (@op $stack:tt $op:tt $($rest:tt)*) => {
    compile_error!(concat!(
      "Could not apply operator `",
      stringify!($op),
      "` to the current stack: ",
      stringify!($stack)
    ))
  };

  // ...
}

Let's try again:

error: Could not apply operator `*` to the current stack: [ 2 + 3 ]
  --> src/main.rs:9:9
   |
9  |         compile_error!(concat!("Could not apply operator ", stringify!($op), " to current stack: ", stringify!($stack)))
   |         ^^^^^^^^^^^^^^^^^^^^^^^^^^^^^^^^^^^^^^^^^^^^^^^^^^^^^^^^^^^^^^^^^^^^^^^^^^^^^^^^^^^^^^^^^^^^^^^^^^^^^^^^^^^^^^^^
...
46 |     println!("{}", rpn!(2 3 + *));
   |                    ------------- in this macro invocation

Much better! Now our macro can evaluate any RPN expression at compile-time, and gracefully handles most common mistakes, so let's call it a day and say it's production-ready :)

There are many more small improvements we could add, but I'd like to leave them outside this demonstration tutorial.

Feel free to let me know if this has been useful and/or what topics you'd like to see better covered on Twitter!

Cloudflare Workers is now on Open Beta

$
0
0
Cloudflare Workers is now on Open Beta

Cloudflare Workers Beta is now open!

Cloudflare Workers lets you run JavaScript on Cloudflare’s edge, deploying globally to over 120+ data centers around the world in less than 30 seconds. Your code can intercept and modify any request made to your website, make outbound requests to any URL on the Internet, and replace much of what you might need to configure your CDN to do today. Even better, it will do this from all our edge locations around the world, closer to many of your users than your origin servers can ever be. You will have a fully functional Turing-complete language in your fingertips which will allow you to build powerful applications on the edge. The only limit is your imagination.
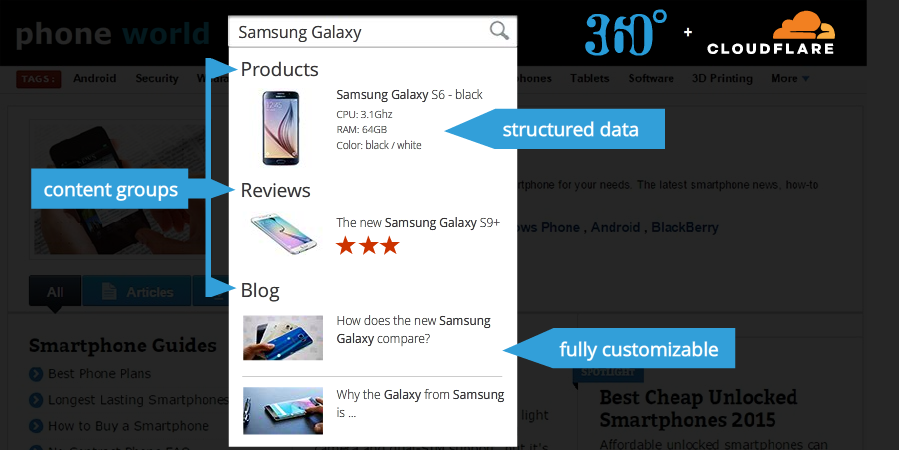
Cloudflare Workers is now on Open Beta

To get started:

  • Sign in to your account on cloudflare.com.
  • Visit the Workers tab.
  • Launch the editor.
  • Write some code and save it.
  • Go to the routes tab and prescribe on what requests you want to run Workers for

That’s it!

You can start by writing a simple ‘hello world’ script, but chances are that you are going write Workers that are more complicated. You can check out our page with recipes to:

We will keep adding new recipes to our docs. All the recipes are in a Github repository; if you'd like to add your own, send us a pull request.

Check out the Workers Community to see what other people are building. Please share your feedback and questions!

Cloudflare Workers is completely free during the open beta. We do intend on charging for Workers, but we will notify you of our plans at least thirty days before any changes are made.


Coming soon to a university near you

$
0
0
Coming soon to a university near you

Attention software engineering students: Cloudflare is coming to the University of Illinois at Urbana-Champaign and the University of Wisconsin–Madison, and we want to meet you! We will be attending UW–Madison’s Career Connection on Wednesday, February 7 and UIUC’s Startup Career Fair on Thursday, February 8. We’ll also be hosting tech talks at UIUC on Friday, February 2 at 6:00pm in 2405 Siebel Center and at UW–Madison on Tuesday, February 6 (time and location coming soon).

Coming soon to a university near you
Cloudflare staff at YHack 2017. Photo courtesy Andrew Fitch.

Built in Champaign

In early 2016, Cloudflare opened an engineering office in Champaign, IL to build Argo Smart Routing. Champaign's proximity to the University of Illinois, one of the nation's top engineering schools, makes it an attractive place for high-tech companies to set up shop and for talented engineers to call home. Since graduating from UIUC in 2008, I've had opportunities to work on amazing software projects, growing technically and as a leader, all while enjoying the lifestyle benefits of Champaign (15 minute commute, anyone?).

Cloudflare has attended annual recruiting events at UIUC since the Champaign office was opened. This year, we've started to expand our search to other top engineering schools in the midwest. In the fall semester we attended a career fair at UW-Madison. We were impressed with the caliber of talent we saw which made it an easy decision to return. Our hope is to show students studying at universities in the midwest the opportunity to build a career right here, working on compelling projects like Argo.

Beyond the Great Plains

While we hope that many students will consider helping us build Argo in Champaign, Cloudflare has many open positions in all of our office locations, including San Francisco, London, and Austin, TX. If you're interested in a particular role or location, come talk to us at the career fairs and we'll help get you connected!

Not a student, but interested in working on Argo in Champaign? Apply here!

How we made our page-load optimisations even faster

$
0
0
How we made our page-load optimisations even faster

In 2017 we made two of our web optimisation products - Mirage and Rocket Loader - even faster! Combined, these products speed up around 1.2 billion web-pages a week. The products are both around 5 years old, so there was a big opportunity to update them for the brave new world of highly-tuned browsers, HTTP2 and modern Javascript tooling. We measured a performance boost that, very roughly, will save visitors to sites on our network between 50-700ms. Visitors that see content faster have much higher engagement and lower bounce rates, as shown by studies like Google’s. This really adds up, representing a further saving of 380 years of loading time each year and a staggering 1.03 petabytes of data transfer!

How we made our page-load optimisations even faster
Cycling image Photo by Dimon Blr on Unsplash.

What Mirage and Rocket Loader do

Mirage and Rocket Loader both optimise the loading of a web page by reducing and deferring the number of assets the browser needs to request for it to complete HTML parsing and rendering on screen.

Mirage

With Mirage, users on slow mobile connections will be quickly shown a full page of content, using placeholder images with a low file-size which will load much faster. Without Mirage visitors on a slow mobile connection will have to wait a long time to download high-quality images. Since it’ll take a long time, they will perceive your website as slow:

How we made our page-load optimisations even faster

With Mirage visitors will see content much faster, will thus perceive that the content is loading quickly, and will be less likely to give up:

How we made our page-load optimisations even faster

Rocket Loader

Browsers will not show content that until all the Javascript that might affect it has been loaded and run. This can mean users wait a significant time before seeing any content at all, even if that content is the only reason they’re on visiting the page!

How we made our page-load optimisations even faster

Rocket Loader transparently defers all Javascript execution until the rest of the page has loaded. This allows the browser to display the content the visitors are interested in as soon as possible.

How we made our page-load optimisations even faster

How they work

Both of these products involve a two step process: first our optimizing proxy-server will rewrite customers’ HTML as it’s delivered, and then our on-page Javascript will attempt to optimise aspects of the page load. For instance, Mirage's server-side rewrites image tags as follows:

<!-- before -->
<img src="/some-image.png">

<!-- after -->
<img data-cfsrc="/some-image.png" style="display:none;visibility:hidden;">

Since browsers don't recognise data-cfsrc, the Mirage Javascript can control the whole process of loading these images. It uses this opportunity to intelligently load placeholder images on slow connections.

Rocket Loader uses a similar approach to de-prioritise Javascript during page load, allowing the browser to show visitors the content of the page sooner.

The problems

The Javascript for both products was written years ago, when ‘rollup’ brought to mind a poor lifestyle choice rather than an excellent build-tool. With the big changes we’ve seen in browsers, protocols, and JS, there were many opportunities to optimise.

Dynamically... slowing things down

Designed for the ecosystem of the time, both products were loaded by Cloudflare’s asynchronous-module-definition (AMD) loader, called CloudflareJS, which also bundled some shared libraries.

This meant the process of loading Mirage or Rocket Loader looked like:

  1. CFJS inserted in blocking script tag by server-side rewriter
  2. CFJS runs, and looks at some on-page config to decide at runtime whether to load Rocket/Mirage via AMD, inserting new script tags
  3. Rocket/Mirage are loaded and run

Fighting browsers

Dynamic loading meant the products could not benefit from optimisations present in modern browsers. Browsers now scan HTML as they receive it instead of waiting for it all to arrive, identifying and loading external resources like script tags as quickly as possible. This process is called preload scanning, and is one of the most important optimisations performed by the brower. Since we used dynamic code inside CFJS to load Mirage and Rocket Loader, we were preventing them from benefitting from the preload scanner.

To make matters worse, Rocket Loader was being dynamically inserted using that villain of the DOM API, document.write - a technique that creates huge performance problems. Understanding exactly why is involved, so I’ve created a diagram. Skim it, and refer back to it as you read the next paragraph:

How we made our page-load optimisations even faster

As said, using document.write to insert scripts is be particularly damaging to page load performance. Since the document.write that inserts the script is invisible to the preload scanner (even if the script is inline, which ours isn’t, preload scanning doesn’t even attempt to scan JS), at the instant it is inserted the browser will already be busy requesting resources the scanner found elsewhere in the page (other script tags, images etc). This matters because a browser encountering a non-deferred or asynchronous Javascript, like Rocket Loader, must block all further building of the DOM tree until that script is loaded and executed, to give the script a chance to modify the DOM. So Rocket Loader was being inserted at an instant in which it was going to be very slow to load, due to the backlog of requests from the preload scan, and therefore causes a very long delay until the DOM parser can resume!

Aside from this grave performance issue, it became more urgent to remove document.write when Chrome began to intervene against it in version 55 triggering a very interesting discussion. This intervention would sometimes prevent Rocket Loader from being inserted on slow 2G connections, stopping any other Javascript from loading at all!

Clearly, document.write needed to be extirpated!

Unused and over-general code

CFJS was authored as a shared library for Cloudflare client-side code, including the original Cloudflare app store. This meant it had quite a large set of APIs. Although both Mirage and Rocket Loader depended on some of them, the overlap was actually small. Since we've launched the new, shiny Cloudflare Apps, CFJS had no other important products dependant upon it.

A plan of action

Before joining Cloudflare in July this year, I had been working in TypeScript, a language with all the lovely new syntax of modern Javascript. Taking over multiple AMD, ES5-based projects using Gulp and Grunt was a bit of a shock. I really thought I'd written my last define(['writing', 'very-bug'], function(twice, prone) {}), but here I was in 2017 seeing it again!

So it was very tempting to do a big-bang rewrite and get back to playing with the new ECMAScript 2018 toys. However, I’ve been involved in enough rewrites to know they’re very rarely justified, and instead identified the highest priority changes we’d need to improve performance (though I admit I wrote a few git checkout -b typescript-version branches to vent).

So, the plan was:

  1. identify and inline the parts of CFJS used by Mirage and Rocket Loader
  2. produce a new version of the other dependencies of CFJS (our logo badge widget is actually hardcoded to point at CloudflareJS)
  3. switch from AMD to Rollup (and thus ECMAScript import syntax)

The decision to avoid making a new shared library may be surprising, especially as tree-shaking avoids some of the code-size overhead from unused parts of our dependencies. However, a little duplication seemed the lesser evil compared to cross-project dependencies given that:

  • the overlap in code used was small
  • over-general, library-style functions were part of why CFJS became too big in the first place
  • Rocket Loader has some exciting things in its future...

Sweating kilobytes out of the minified + Gzipped Javascript files is be a waste of time for most applications. However, in the context of code that'll be run literally millions of times in the time you read this article, it really pays off. This is a process we’ll be continuing in 2018.

Switching out AMD

Switching out Gulp, Grunt and AMD was a fairly mechanical process of replacing syntax like this:

define(['cloudflare/iterator', 'cloudflare/dom'], function(iterator, dom) {
    // ...
    return {
        Mirage: Mirage,
    };
})

with ECMAScript modules, ready for Rollup, like:

import * as iterator from './iterator';
import { isHighLatency } from './connection';

// ...

export { Mirage }

Post refactor weigh-in

Once the parts of CFJS used by the projects were inlined into the projects, we ended up with both Rocket and Mirage being slightly larger (all numbers minified + GZipped):

So we made a significant file-size saving (about half a jQuery’s worth) vs the original file-size required to completely load either product.

New insertion flow

Before, our original insertion flow looked something like this:

// on page embed, injected into customers' pages
<script>
  var cloudflare = { rocket: true, mirage: true };
</script>
<script src="/cloudflare.min.js"></script>

Inside cloudflare.min.js we found the dynamic code that, once run, would kick off the requests for Mirage and Rocket Loader:

// cloudflare.min.js
if(cloudflare.rocket) {
    require(“cloudflare/rocket”);
}

Our approach is now far more browser friendly, roughly:

// on page embed
<script>
  var cloudflare = { /* some config */ }
</script>
<script src="/mirage.min.js"></script>
<script src="/rocket.min.js"></script>

If you compare the new insertion sequence diagram, you can see why this is so much better:

How we made our page-load optimisations even faster

Measurement

Theory implied our smaller, browser-friendly strategy should be faster, but only by doing some good old empirical research would we know for sure.

To measure the results, I set up a representative test page (including Bootstrap, custom fonts, some images, text) and calculated the change in the average Lighthouse performance scores out of 100 over a number of runs. The
metrics I focussed on were:

  1. Time till first meaningful paint (TTFMP) - FMP is when we first see some useful content, e.g. images and text
  2. Overall - this is Lighthouse's aggregate score for a page - the closer to 100, the better

Assessment

So, improved metrics across the board! We can see the changes have resulted in solid improvements, e.g a reduction in our average time till first meaningful paint of 694ms for Rocket, and 49ms for Mirage.

Conclusion

The optimisations to Mirage and Rocket Loader have resulted in less bandwidth use, and measurably better performance for visitors to Cloudflare optimised sites.


Footnotes

  1. The following are back-of-the-envelope calculations. Mirage gets 980 million requests a week, TTFMP reduction of 50ms. There are 1000 ms in a second * 60 seconds * 60 minutes * 24 hours * 365 days = 31.5 billion milliseconds in a year. So (980e6 * 50 * 52) / 31.5e9 = in aggregate, 81 years less waiting for first-paint. Rocket gets 270 million requests a week, average TTFMP reduction of 694ms, (270e6 * 694 * 52) / 31.5e9 = in aggregate, 301 years less waiting for first-meaningful-paint. Similarly 980 million savings of 16kb per week for Mirage = 817.60 terabytes per year and 270 million savings of 15.2kb per week for Rocket Loader = 213.79 terabytes per year for a combined total of 1031 terabytes or 1.031 petabytes.
  2. and a tiny 1.5KB file for our web badge - written in TypeScript 👍 - which previously was loaded on top of the 21.6KB CFJS
  3. shut it Hume
  4. Thanks to Peter Belesis for doing the initial work of identifying which products depended upon CloudflareJS, and Peter, Matthew Cottingham, Andrew Galloni, Henry Heinemann, Simon Moore and Ivan Nikulin for their wise counsel on this blog post.
Viewing all 1117 articles
Browse latest View live